Soybean rebound in a down channel, good risk-reward opportunitySoybean rebound in a down channel; good risk-reward opportunity. Price and levels are in the chart. Good luckLongby richard7_Updated 1
SOY cluster support is here! 🔥seeing strong trend/local support zones, a bounce here and rally to 1476-1604 targets is very possible scenario! break below 1127 is invalidation and we can expect dip before more rip.. boost and follow for more.. thanks 💝Longby Vibranium_CapitalUpdated 3310
very bearish break below support zone🐻hard to consider longs here unless we reclaim support/488 level.. For now a dip to 350-400 is very possible before the next rally comes boost and follow for more.. thanks! ❤️🔥Shortby Vibranium_CapitalUpdated 8
Wheat looks good for a long ride to the upsideThe prices are at the lows and the structure shows a rejection at low prices and, it´s ready to launch the price to the upside and recover part of its year looses. Good luck!Longby richard7_3
CORN: Trend in daily time framePlease pay special attention to the very accurate trend, channel and colored levels. Be careful BEST MTby MT_T1
SOYBEAN A TURN AROUND INTO BULL RUNThe soybean seems to be entering the Bull Run depending on the technical and fundamentals. The Divergence is seen on the RSI charts; Wherein the Seasonality and smart money positions are also signaling a possible turn around into a bull run for the SOYBEAN. What are your views ????Longby NEXTIn_Financials2
Corn Short, Technical, Fundamental and COT Analysis Current Corn Short Entered originally, and admittedly prematurely, when we saw price touch the 61.8% fib retracement level. Entered a short position last month as price has been steadily falling since June last year. The falling price of corn is being caused by simply an overabundance of supplyShortby DedoAUS1
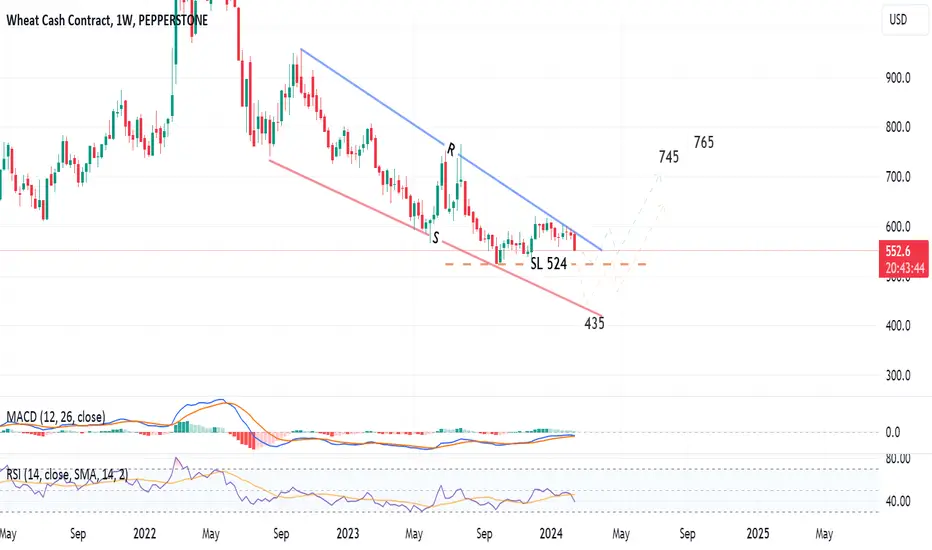
Wheat is trading in a falling wedge!Weekly chart, wheat cash contract is trading in a falling wedge! Will we see the 435 - 400 price level or rebound upwards from 520 - 525? It is tough to confirm.. However, this falling wedge pattern has a higher probability that the price will cross the resistance (line R) upwards towards 745 and 7by snour4
WHEAT - Bottom is near!After a failed rally, it fell down the break the last low and is now grinding out a bottom. This looks like a good opportunity to long by buying small positions every week for next few months. There has also been a completion of a three-wave correction, which helps to further strengthen the case thaLongby TheTrexUpdated 11
corn weekly breakout coming ?I see that in the last 2 major tops in Corn futures had significant pops at the .786 fib retracement and never completed the H&S to baseline and my premise is that its baked in inflation and it will happen again truncated descent right here. Its in a wedge descending to a narrow point and ready tLongby NuclearSunset1