CREAM Finance 12h signal CREAM has also some nice potential here..on this chart.
It can wick-pump like it did before in december on Christmas
Here are some basic fib targets !
Have a nice bull run !
CREAMUSDT trade ideas

CREAMUSDT.1DUpon examining the CREAM/USDT daily chart, several critical technical indicators and levels are evident, offering insights into potential price movements.
Trend and Resistance Analysis:
The chart shows that Cream Finance (CREAM) has experienced a significant price increase, currently trading around 84.53 USD. The price recently spiked to a high of 97.97 USD before retracing. There are two major resistance levels to watch: R1 at 85.60 USD and R2 at 113.22 USD. The price is currently testing R1, and a successful break above this level could see it testing R2, indicating further bullish momentum.
Support Levels:
On the downside, the primary support level is identified as S1 at 73.70 USD. This level has shown strong buying interest and could act as a floor if the price continues to decline. Below S1, the next significant support level is S2 at 56.46 USD, which has been a critical support zone in the past.
RSI and MACD Indicators:
The Relative Strength Index (RSI) is currently at 79.91, indicating that the asset is in the overbought territory. This suggests that the asset might be due for a correction or consolidation before any further upward movement. The Moving Average Convergence Divergence (MACD) indicator is showing strong bullish momentum, with the MACD line (blue) well above the signal line (orange)
and a positive histogram. However, the overbought RSI warrants caution.
Volume Analysis:
The volume pattern indicates that the recent price spike was accompanied by significant trading volume, suggesting strong market participation during upward movements. This heightened volume reinforces the bullish sentiment but also indicates the potential for volatility.
Conclusion:
In conclusion, the CREAM/USDT pair is currently in a strong bullish trend but is showing signs of being overbought according to the RSI. The MACD supports continued bullish momentum, but the overbought RSI suggests that a correction or consolidation might be imminent. Traders should closely monitor the support levels at 73.70 USD and 56.46 USD, as well as the resistance levels at 85.60 USD and 113.22 USD. A break above the resistance levels would confirm continued bullish momentum, while a failure to hold the support levels could lead to a deeper retracement.
Overall, the market sentiment for CREAM remains cautiously optimistic, with critical attention needed at the aforementioned levels and indicators to make informed trading decisions.

CREAMUSDT IDEAHey traders hope you are enjoying our analysis. Now we are here again with a new trading opportunity. We will discuss today about CREAM
CREAM Finally Hits Our Target +30% Profit Done ✅ 💰💵
🔥 🔥 🔥

**** LINKUSDT UPDATE *****#LINKUSDT
(UPDATE)
Hey dear members hope you all are enjoying our ideas and analysis. Now we are here to discuss about CREAM
CREAM has breaked the main Bullish pennant pattern already getting good volume. We can see gain here upto 55%+ soon.

CREAM Surges with Breakout Momentum: Eyes Set on $100!
Key Observations:
Ascending Channel Breakout:
The price has been trading within an ascending channel, with higher highs and higher lows.
A breakout from the channel is observed, with the price rising sharply from around $43 to $71.34 , indicating strong bullish momentum.
Support and Resistance Levels:
Major support levels identified: $15.59 and $42.34.
Major resistance levels identified: $58.57, $70.50 , and $100.45.
Volume and Price Action:
The volume appears to have increased significantly during the breakout, confirming the strength of the upward movement.
Candlestick Patterns:
The chart shows a large bullish candlestick, indicative of strong buying interest.
Indicators:
Stochastic RSI at the bottom of the chart is showing an underbought condition (below 20 level). This may indicate potential for a long-term bullish.
Technical Analysis:
Breakout Confirmation:
The price broke out of the ascending channel with a strong bullish candle, suggesting a possible continuation of the uptrend.
After breaking above $58.57 (previous resistance), the price surged to $71.34, confirming the breakout.
Potential Pullback:
Given the overbought condition on the Stochastic Oscillator, a pullback or consolidation phase might be imminent before further upward movement.
A retest of the breakout level around $58.57 or even the $42.34 support level is possible, which would be a healthy correction.
Price Targets:
Short-term target : The price could aim for $70.50 again, as it is the immediate resistance.
Mid-term target : If the bullish momentum continues, the next target would be $100.45, which aligns with the measured move from the breakout.
Long-term target : Sustained momentum could push the price beyond $100.45, but this would require continuous strong buying pressure and favorable market conditions.
I will keep updating this chart overtime

CREAMUSDT IDEAHey traders hope you are enjoying our analysis. Now we are here again with a new trading opportunity. We will discuss today about CREAM
CREAM THE Bullish pennant Formation in 8H Timeframe✍️
In case Of Breakout,Expecting
30% Bullish Wave🚀


CREAMUSDT IDEAHey traders hope you are enjoying our analysis. Now we are here again with a new trading opportunity. We will discuss today about CREAM
CREAM The Rising Wedge Breakout Already Confirmed in 2H Timeframe✍️
Expecting Massive Bullish Wave📈

Long trade position CREAMUSDTTest your analytical skills in the tradingview simulator with virtual money to become a professional. In spot trading, I will specify the entry points, loss limit and profit limit for you! The conditions for entering the trade and our strategy are as follows, when you notice that the market trend is increasing and at least two green candles close above the entry point in fifteen minutes, you can enter the trade from the beginning of the third green candle. Be patient and don't rush to enter! After the price reaches the first target, move your stop loss below the first profit limit so that if the price reverses, your trade will be closed with profit. Repeat the above strategy to continue the price targets shown on the chart. If the price reaches or falls below our loss limit before the above condition, entering this transaction is invalid because it must be re-analyzed and the new entry, loss and profit limits must be determined. Note that the market trend is formed with clever tricks by the market maker, so even the most powerful analyzes may be invalidated. The only thing we can do is to surf the waves and stick to our strategy so that while taking care of our capital, Let's make a profit. These exercises will make you experience profit and loss with virtual money in the real market and improve your analysis and personal strategy. Know your fear and greed and gradually control them so that your business becomes profitable and you suffer less loss.

CREAMUSDT IDEAHello Traders Hope You Are Enjoying Our Analysis. Today We Will Discuss About CREAM
(Update)
The Ascending Channel Breakout Has Done In 4H Timeframe✅
Expecting Massive Bullish Wave In Few Days⚡️

CREAMUSDT IDEA
Hey traders hope you are enjoying our analysis. Now we are here again with a new trading opportunity. We will discuss today about CREAM CREAM Finaly Hits Our Target +70% Profit Done ✅ 💰💵
🔥 🔥 🔥

CREAMUSDT IDEAHello Traders Hope You Are Enjoying Our Analysis. Today We Will Discuss About CREAM
(Update)
Trying To Breakout Ascending Channel Incase Of Successful Breakout Expecting Massive Bullish Wave⚡️⚡️

CREAMUSDT IDEAHey traders hope you are enjoying our analysis. Now we are here again with a new trading opportunity. We will discuss today about CREAM
CREAM Moving As Expected & Running In +30% Profit So Far✍️
Expecting 70% bullish wave in coming days🚀

CREAM / super bullish ✅my last target ( 22$ ) ✅
and now cream is super bullish
as a long term i think about 77 $ in 2024
Good luck ❤


CREAMIts seems to breakout the line and a good position for long
CREAM had no good move yet 🍦😊
I think about a good move

C.R.E.A.M. Finance CREAM/USDT Waiting for a potential breakout.
About Cream Finance (CREAM)
C.R.E.A.M. Finance is a decentralized DeFi lending platform, enabling financial services to a broad range of entities—from individuals to institutions.
As an integral part of the yearn.finance family, it aims to differentiate itself with its open-source, permissionless nature and compatibility with multiple blockchains, including Ethereum, BNB Chain, Polygon, and Fantom.
Users holding assets like Ether or wBTC and seeking avenues to optimize them, can position these assets onto C.R.E.A.M. to earn yields.
......................................................................................................................
We are not registered or licensed in any jurisdiction whatsoever to provide investing advice or anything of an advisory or consultancy nature.
and are therefore are unqualified to give investment recommendations.
Always do your own research and consult with a licensed investment professional before investing.
This communication is never to be used as the basis of making investment decisions, and it is for entertainment purposes only.

CREAMUSDT - BULLISH OUTLOOKCREAMUSDT is displaying a bullish trend, indicating a potential trading opportunity for a continuation of the upward movement. Here's a concise analysis and trade plan:
Entry: Consider entering a long position at the current market price (CMP) of $18.60.
Stop Loss (SL): Set the stop loss at $16.20 to manage potential downside risk.
Take-Profit Levels:
TP 1 @ 1:1 = $21.00.
TP 2 @ 1:2 = $23.40.
TP 3 @ 1:3 = $25.80.
After reaching the first take-profit level, consider adjusting the stop loss to the entry point (breakeven) to secure profits and minimize further risk.
This trade plan is designed to capitalize on the observed bullish trend in CREAMUSDT, with well-defined entry, stop loss, and take-profit levels. Entering at the current market price and adjusting the stop loss after reaching the first take-profit level aligns with a prudent trading approach. As always, staying informed and adapting to market conditions is crucial for successful trading.


Cream 8 is bullish ifCream is looking bullish on different time frames
It has a couple of patterns classic and harmonic
We have SL to be closed below it for one day and I prefer personally closing for one day below trigger C
All the best insha Allah!

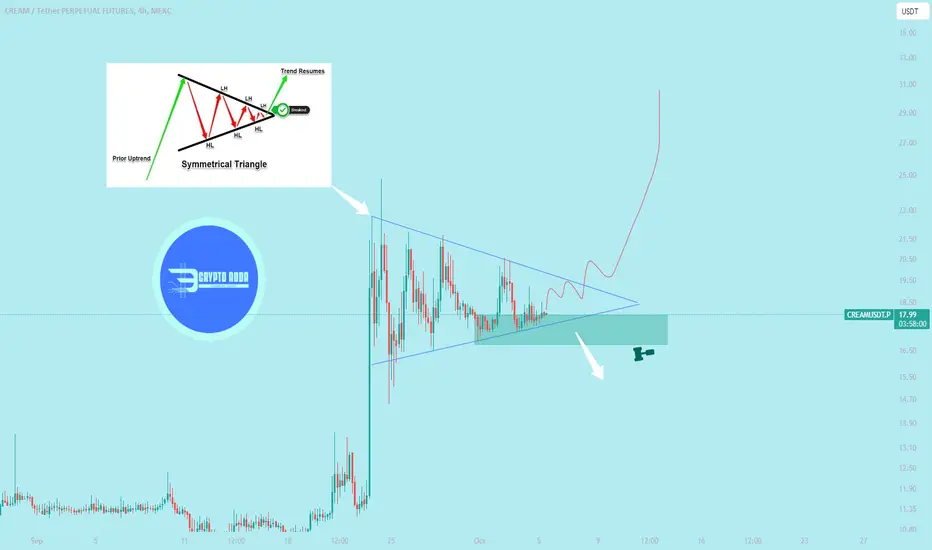
$CREAM performing symmetrical triangle$CREAM performing in 1hr symmetrical triangle
Trading a symmetrical triangle pattern involves identifying potential breakouts and using technical analysis to make informed trading decisions. Here are the steps to trade a symmetrical triangle pattern:
1. **Identify the Symmetrical Triangle:** First, recognize the formation of a symmetrical triangle on a price chart. This pattern typically consists of converging trendlines, with a series of higher lows and lower highs, creating a triangular shape.
2. **Determine the Direction:** Pay attention to the direction of the price trend leading into the triangle. If the price was in an uptrend before entering the pattern, there's a higher likelihood of a bullish breakout. Conversely, if it was in a downtrend, a bearish breakout is more probable.
3. **Set Entry and Stop-Loss Levels:** To trade a symmetrical triangle, you'll want to wait for a breakout from the pattern. Set your entry order slightly above the upper trendline for a bullish breakout or slightly below the lower trendline for a bearish breakout. Place a stop-loss order to limit potential losses.
4. **Confirm the Breakout:** Don't jump the gun. Wait for a confirmed breakout, which is usually accompanied by increased volume and a significant price movement beyond the trendline. This confirms the direction of the breakout.
5. **Measure the Price Target:** Use the height of the triangle at its widest point to estimate the price target. For a bullish breakout, add this measurement to the breakout point; for a bearish breakout, subtract it. This provides an initial price target.
6. **Monitor and Adjust:** Keep a close eye on your trade and adjust your stop-loss and take-profit levels as the price moves. This will help protect your profits and minimize losses.
7. **Consider Volume and Confirmation:** While symmetrical triangles often result in significant breakouts, not all breakouts are equally reliable. Look for strong confirmation through volume and other technical indicators (such as moving averages) to increase the reliability of your trade.
8. **Practice Risk Management:** Only risk a small portion of your trading capital on any single trade, and don't over-leverage. Stick to a risk-reward ratio that makes sense for your overall trading strategy.
Remember that trading involves risk, and it's important to have a solid understanding of technical analysis, risk management, and a trading plan before attempting to trade any chart patterns, including the symmetrical triangle. It's also advisable to practice on a demo account or paper trade to gain experience before risking real money.

CREAMUSDT TODAYPLZ DO NOT SELL MY SIGNALS
1-Apply your own risk management.
2-Daily and Weekly Targets
3-Hunt the profits at any level you see convenient for you.
have a good day guys.

$CREAM still so look bullish$CREAM Performed Bullish Symmetrical in 1D TF
What is a Symmetrical Triangle
A symmetrical triangle is a chart pattern characterized by two converging trend lines connecting a series of sequential peaks and troughs. These trend lines should be converging at a roughly equal slope. Trend lines that are converging at unequal slopes are referred to as a rising wedge, falling wedge, ascending triangle, or descending triangle.
KEY TAKEAWAYS
Symmetrical triangles occur when a security's price is consolidating in a way that generates two converging trend lines with similar slopes.
The breakout or breakdown targets for a symmetrical triangle is equal to the distance between the initial high and low applied to the breakout or breakdown point.
Many traders use symmetrical triangles in conjunction with other forms of technical analysis that act as a confirmation.