CRV very bullish chartsBoth pairs CRV-BTC and CRV-USD looks ready to breakout.
Similar charts: XLM-BTC, ZRX-BTC
CEX: Binance, Coinbase etc.
DEX: Most of well-known DEXes
I might be wrong.
DYOR
CRVBTC trade ideas


CRV: 9k - 13.5k stsCRV will reach 9k & 13.5k sts soon. So you can continue holding strategy.
About 17.5k sts: maybe.
20.5k sts: we need stronger bullrun :)

CRV/BTC - Trading setup! Not a financial advice - This is my trading diary ! It helps me think about my ideas.
I have no idea what CRV means or what this thing does, the only thing I know for sure is that its chart respects Fibs and SRs very well.
#CRV/BTC
Entry: 5888 - 5738 - 5481
- Fib confluences + order blocks + possible SFP
Targets : 6602 (40%) -7010 (40%) - 7475 (20%) = > Or hold a bag til 8924
- Targets based on SR levels / Fibs
Stoploss : Daily close below 4650 - Wicks are common in cryptoland.
- Risk: 1% of your account.
- Potential Risk Reward Ratio: 2.72
- Move SL to Breakeven after hitting TP1
- Estimated time: Week 19/20-2021
#altcoins #crypto #crv #btc
Disclaimer: No point in chasing the market. I will either let it come to my level or pass the trade.


Crypto|CRV/BTC|Long and shortLong and short CRV/BTC
Activation of the transaction only when the blue zone is fixed/broken.
The author recommends the use of anchoring fixed the blue zone, this variation is less risky.
If there is increased volatility in the market and the price is held for more than 2-3 minutes behind the activation zone after the breakdown, then the activation of the idea occurs at the prices behind the activation zone.
Working out the support and resistance levels of the consolidation zone.
* Possible closing of a trade before reaching the take/stop zone. The author can close the deal for subjective reasons, this does not completely cancel the idea and is not a call to the same action, you can continue working out the idea according to your data, but without the support of the author.
+ ! - zone highlighted by the ellipse is a zone of increased resistance, in this area there is a possible reversal for a correction, please take this factor into account in this transaction.
The "forecast" tool is used for more noticeable display of % (for the place of the usual % scale) of the price change, I do not put the date and time of the transaction, only %.
The breakdown of the upper blue zone - long.
Breakdown of the lower blue zone - short.
Working out the stop when the price returns to the level after activation + fixing in the red zone.
Blue zones - activation zones.
Green zone - take zone.
Red zone - stop zone.
Orange arrows indicate the direction of the take.
Red arrows indicate the direction of the stop.
Priority - The value of the priority parameter implies the author's subjective opinion about the more likely activation zone on this idea, this does not mean that this idea will be 80% activated by this parameter, the purpose of the parameter is to provide for the risk of the inverse of the zone parameter.
Example: "Priority Long: So the author inclines more in the direction of the activation zone open long trades, in this case, when reaching the activation zone in short you should be very careful, because this area may be highly likely to be punched about the breakdown/do not get to take/activate transaction from go to stop."
Please consider this parameter if you use my ideas.
SUM PNL: This parameter displays the total % of all closed ideas of the "new" format (according to the author) for this sector at the time of publication of the idea. The calculation is very "clumsy" just the sum of the profits of all the ideas, based on this indicator, you can more accurately assess the risks when working with my ideas of this sector. I present you the construction of the idea, you can use it yourself as you like based on your subjective view and risks, the calculation of the PNL indicator is carried out only on transactions that the author closed on TV in manual mode or by take.
P.S Please use RM (risk management) and MM (money management) if you decide to use my ideas, there will always be unprofitable ideas, this will definitely happen, the goal of the system is that there will be more profitable ideas at a distance.


Crv/Btc Target 2400The target is given on the chart. I will be very happy if you contribute by liking it.

CRV vs USD & CRV vs BTC - good to have in portfolio😉Hello! CRV (doesn't matter in USD or BTC) formed CUP & HANDLE pattern!
It is worth considering the following when detecting cup and handle patterns:
Length: Generally, cups with longer and more "U" shaped bottoms provide a stronger signal. Avoid cups with a sharp "V" bottoms.
Depth: Ideally, the cup should not be overly deep. Avoid handles that are overly deep also, as handles should form in the top half of the cup pattern.
Volume: Volume should decrease as prices decline and remain lower than average in the base of the bowl; it should then increase when the stock begins to make its move higher, back up to test the previous high.
A retest of previous resistance is not required to touch or come within several ticks of the old high; however, the further the top of the handle is away from the highs, the more significant the breakout needs to be.
KEY TAKEAWAYS
A cup and handle is a technical chart pattern that resembles a cup and handle where the cup is in the shape of a "u" and the handle has a slight downward drift.
A cup and handle is considered a bullish signal extending an uptrend, and is used to spot opportunities to go long.
Technical traders using this indicator should place a stop buy order slightly above the upper trendline of the handle part of the pattern.
Thanks for attention🙏
If you liked my chart, don't forget to click LIKE, it's not difficult for You, but I'm pleased ♥ ️
Also subscribe for not get lost😉
Always sincere with You♥️
Your Rocket Bomb🚀💣


CRVBTC - Long - Potential 15.43%CRVBTC - Long - Potential 15.43%
Exchanges: Binance
Signal Type: Regular (Long)
Entry Zone:
0.0000537 - 0.0000555
Take-Profit Targets:
1) 0.0000591
2) 0.0000640
Stop Targets:
1) 0.0000510
Trailing Configuration:
Entry: Percentage (0.0%)

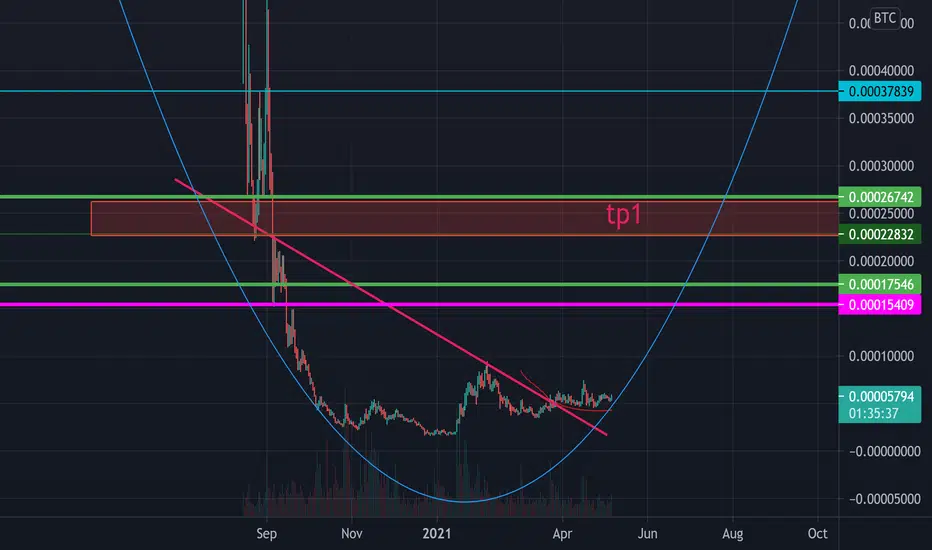
CRV Macro Wave CountOne scenario to test weekly supply in Fall 2021. Just when BTC is due to go parabolic according to the S2FX Model, it would be logical to see alts, such as CRV, go parabolic as well.
