Corbion NV
No trades
Next report date
—
Report period
—
EPS estimate
—
Revenue estimate
—
1.38 USD
56.32 M USD
1.33 B USD
54.43 M
About Corbion NV
Sector
Industry
CEO
Olivier Rigaud
Website
Headquarters
Amsterdam
Founded
1919
IPO date
Jan 4, 1999
Identifiers
2
ISIN NL0010583399
Corbion NV engages in the development, production, sale, and distribution of ingredients for food and biochemicals. It operates through the following segments: Food and Biochemicals. The Food segment provides biobased ingredients for the food industry. The Biochemicals segment produces chemicals derived from organic acids through the fermentation of carbohydrates, and lactic acid based solutions. The company was founded on August 21, 1919 and is headquartered in Amsterdam, the Netherlands.
Related stocks
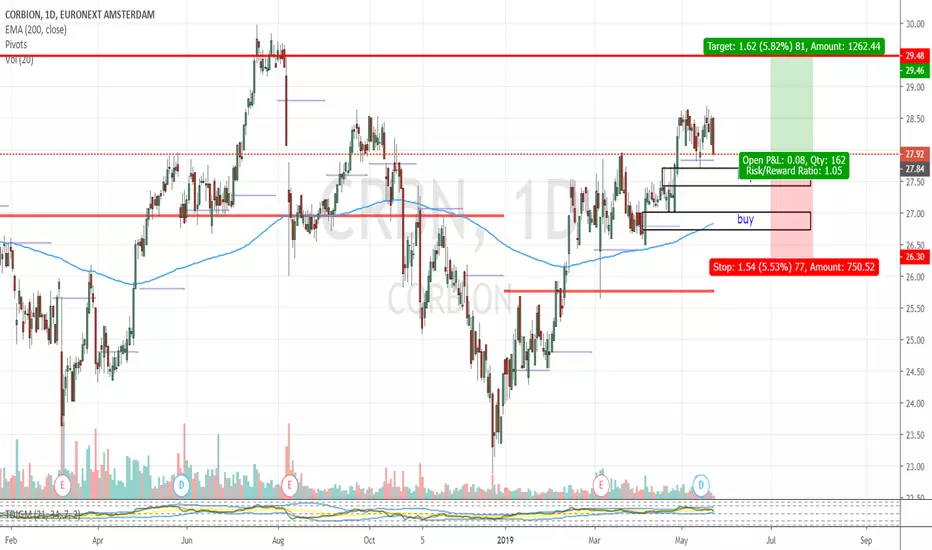
6th Trade: Corbion Breaking ResistanceThe 6th trade in the challenge was executed on the 17th July. With very little cash balance left over, I decided to buy some call options on Corbion (CRBN). According to the B52 Strategy, the stock is in a continuation pattern.
Trade Details
17/07/2018 14:49 17/07/2018 Buy 2 CSM C45.00 15MAR19@0.0
CORBION. buy?It could break to the downside, in that case i wont be looking for a buy. For now lets wait what price action will do.


See all ideas
Summarizing what the indicators are suggesting.
Neutral
SellBuy
Strong sellStrong buy
Strong sellSellNeutralBuyStrong buy
Neutral
SellBuy
Strong sellStrong buy
Strong sellSellNeutralBuyStrong buy
Neutral
SellBuy
Strong sellStrong buy
Strong sellSellNeutralBuyStrong buy
An aggregate view of professional's ratings.
Neutral
SellBuy
Strong sellStrong buy
Strong sellSellNeutralBuyStrong buy
Neutral
SellBuy
Strong sellStrong buy
Strong sellSellNeutralBuyStrong buy
Neutral
SellBuy
Strong sellStrong buy
Strong sellSellNeutralBuyStrong buy
Displays a symbol's price movements over previous years to identify recurring trends.
Frequently Asked Questions
The current price of CSNVF is 21.50 USD — it has increased by 3.94% in the past 24 hours. Watch Corbion NV stock price performance more closely on the chart.
Depending on the exchange, the stock ticker may vary. For instance, on OTC exchange Corbion NV stocks are traded under the ticker CSNVF.
We've gathered analysts' opinions on Corbion NV future price: according to them, CSNVF price has a max estimate of 37.05 USD and a min estimate of 20.32 USD. Watch CSNVF chart and read a more detailed Corbion NV stock forecast: see what analysts think of Corbion NV and suggest that you do with its stocks.
CSNVF reached its all-time high on Feb 17, 2021 with the price of 61.10 USD, and its all-time low was 10.90 USD and was reached on Oct 27, 2008. View more price dynamics on CSNVF chart.
See other stocks reaching their highest and lowest prices.
See other stocks reaching their highest and lowest prices.
CSNVF stock is 3.79% volatile and has beta coefficient of 0.94. Track Corbion NV stock price on the chart and check out the list of the most volatile stocks — is Corbion NV there?
Today Corbion NV has the market capitalization of 1.46 B, it has decreased by −1.05% over the last week.
Yes, you can track Corbion NV financials in yearly and quarterly reports right on TradingView.
Corbion NV is going to release the next earnings report on Feb 26, 2026. Keep track of upcoming events with our Earnings Calendar.
CSNVF net income for the last half-year is 49.95 M USD, while the previous report showed 26.81 M USD of net income which accounts for 86.28% change. Track more Corbion NV financial stats to get the full picture.
Yes, CSNVF dividends are paid annually. The last dividend per share was 0.71 USD. As of today, Dividend Yield (TTM)% is 3.00%. Tracking Corbion NV dividends might help you take more informed decisions.
Corbion NV dividend yield was 2.96% in 2024, and payout ratio reached 68.74%. The year before the numbers were 3.15% and 49.42% correspondingly. See high-dividend stocks and find more opportunities for your portfolio.
As of Feb 14, 2026, the company has 2.4 K employees. See our rating of the largest employees — is Corbion NV on this list?
EBITDA measures a company's operating performance, its growth signifies an improvement in the efficiency of a company. Corbion NV EBITDA is 226.41 M USD, and current EBITDA margin is 13.20%. See more stats in Corbion NV financial statements.
Like other stocks, CSNVF shares are traded on stock exchanges, e.g. Nasdaq, Nyse, Euronext, and the easiest way to buy them is through an online stock broker. To do this, you need to open an account and follow a broker's procedures, then start trading. You can trade Corbion NV stock right from TradingView charts — choose your broker and connect to your account.
Investing in stocks requires a comprehensive research: you should carefully study all the available data, e.g. company's financials, related news, and its technical analysis. So Corbion NV technincal analysis shows the sell today, and its 1 week rating is sell. Since market conditions are prone to changes, it's worth looking a bit further into the future — according to the 1 month rating Corbion NV stock shows the sell signal. See more of Corbion NV technicals for a more comprehensive analysis.
If you're still not sure, try looking for inspiration in our curated watchlists.
If you're still not sure, try looking for inspiration in our curated watchlists.