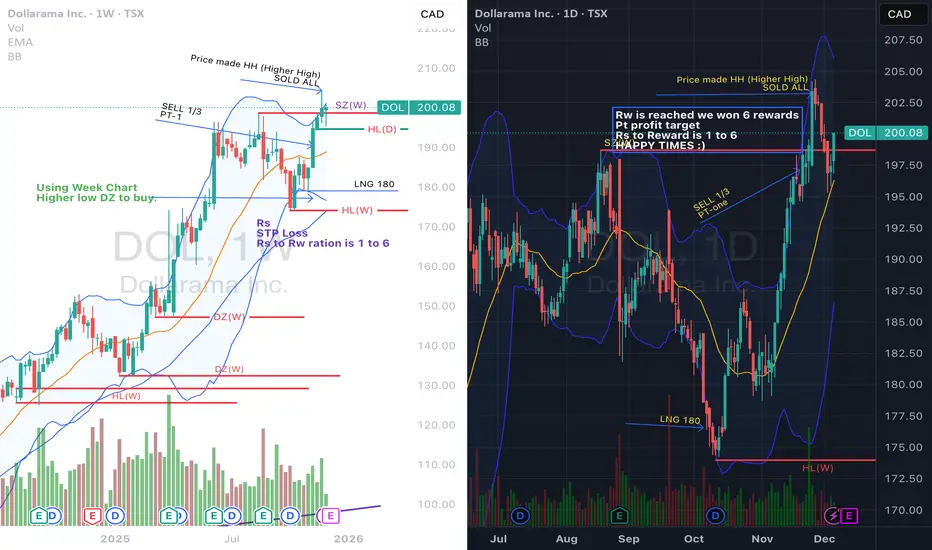
A Clear way to Trade & make profitThis method am about to explain to you has been tested & battle proofed, it is the same trading method taught at Trading school academies & is how the pro traders trade. if followed it would yield 65 to 75 probability in your favor on charts with day or smaller timeframes and a 75 to 90 probability
Dollarama, Inc.
No trades
Next report date
—
Report period
—
EPS estimate
—
Revenue estimate
—
3.37 USD
804.01 M USD
4.41 B USD
267.47 M
About Dollarama Inc.
Sector
Industry
CEO
Neil George Rossy
Website
Headquarters
Montréal
Founded
1992
IPO date
Oct 16, 2009
Identifiers
3
ISIN CA25675T1075
Dollarama, Inc. engages in the provision of online shopping services to various customers. It offers an assortment of general merchandise, consumable products, and seasonal items. The company was founded by Lawrence Rossy in 1992 and is headquartered in Montreal, Canada.
Related stocks

A clear & simple way to trade..and how to make a profitThis method am about to explain to you has been tested & battle proofed, it is the same trading method touch at Trading schools academies & is how the pro traders trade/use. It if followed it would yield 65 to 75 probability in your favor on charts with day or smaller timeframes and a 75 to 90 proba
The king of canadian dollar storesthe king of canadian dollar stores. a solid swing, but also porbbaly a long term buy. An overall great company

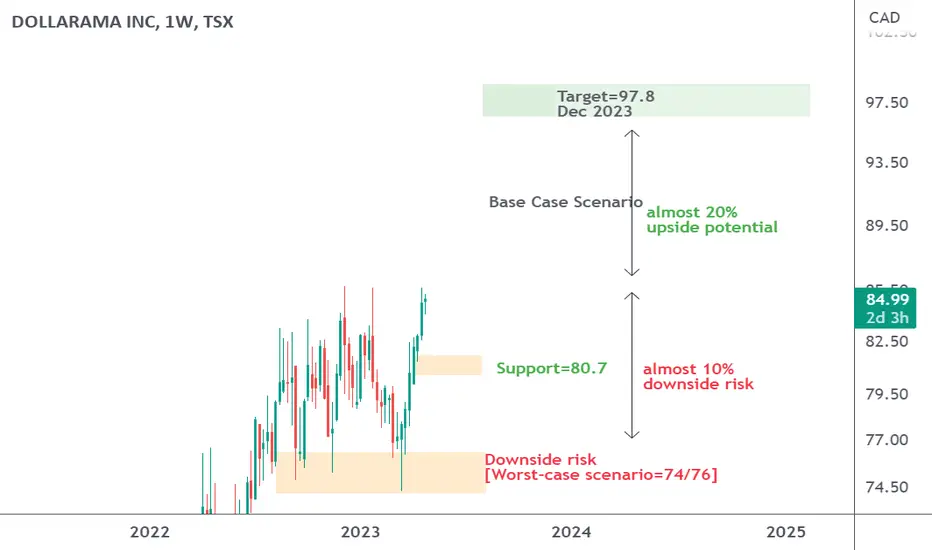
Dollarama is likely to break above 85.75; Risk=75, Upside=97.5Dollarama steadily rising trend is approaching toward a key resistance at 85.75. The ongoing pattern suggests that Dollarama’s stock price is about to break above the key resistance reaching to 97.8 target by the end of this year. Stock is currently trading above 200-day moving average which indicat
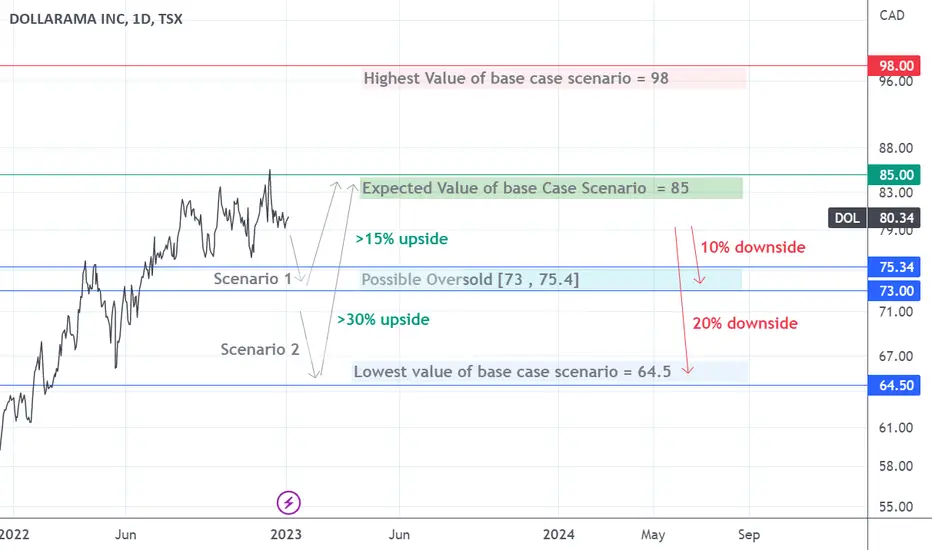
DOL: signs of upside exhaustionsDollarama steadily rising trend seems to have stalled since Aug 2022 when stock price struggled to move above 83.5. Although the long-term bullish trend still is intact, however some signs of upside exhaustions indicate the possible downside risk toward a range between 73 and 75.4.
Dollarama’s stock

easy money dollaramaThe Canadian dollar has started to increase and it seemed it has a long way to go. Dollarama is one of the vital veins of the Canadian economy and the minor recovery in the economy would change this stock to a skyrocket!
% 4-5 is the easiest target for now, but in my humble opinion, $100 is not so

Late to the Game For those who are interested in my TSX watches:
DOL is one that I play frequently as a swing trade whenever a long opportunity presents. However, the TSX seems pretty late to the game in terms of the world dramas (recession, interest hikes, etc.) however the TSX Index has fallen quite a lot, with
Still behind pandemic gains!35% increase from pre pandemic has not priced in the growth and expansion thats coming DOL's way for sure and that along inflation and belt tightening times and 5$ prices can easily push DOL past the 80$ mark , on technical side a long time channel has been broken upwards signaling a new lower and u

Dollaramma Canada Sun Storm Investment Trading Desk & NexGen Wealth Management Service Present's: SSITD & NexGen Portfolio of the Week Series
Focus: Worldwide
By Sun Storm Investment Research & NexGen Wealth Management Service
A Profit & Solutions Strategy & Research
Trading | Investment | Stocks | ETF | Mutua

See all ideas
Summarizing what the indicators are suggesting.
Neutral
SellBuy
Strong sellStrong buy
Strong sellSellNeutralBuyStrong buy
Neutral
SellBuy
Strong sellStrong buy
Strong sellSellNeutralBuyStrong buy
Neutral
SellBuy
Strong sellStrong buy
Strong sellSellNeutralBuyStrong buy
An aggregate view of professional's ratings.
Neutral
SellBuy
Strong sellStrong buy
Strong sellSellNeutralBuyStrong buy
Neutral
SellBuy
Strong sellStrong buy
Strong sellSellNeutralBuyStrong buy
Neutral
SellBuy
Strong sellStrong buy
Strong sellSellNeutralBuyStrong buy
Displays a symbol's price movements over previous years to identify recurring trends.
Frequently Asked Questions
The current price of DLMAF is 140.39 USD — it has increased by 0.37% in the past 24 hours. Watch Dollarama, Inc. stock price performance more closely on the chart.
Depending on the exchange, the stock ticker may vary. For instance, on OTC exchange Dollarama, Inc. stocks are traded under the ticker DLMAF.
DLMAF stock has fallen by −3.11% compared to the previous week, the month change is a −3.67% fall, over the last year Dollarama, Inc. has showed a 43.34% increase.
We've gathered analysts' opinions on Dollarama, Inc. future price: according to them, DLMAF price has a max estimate of 172.58 USD and a min estimate of 143.21 USD. Watch DLMAF chart and read a more detailed Dollarama, Inc. stock forecast: see what analysts think of Dollarama, Inc. and suggest that you do with its stocks.
DLMAF reached its all-time high on Dec 26, 2025 with the price of 160.86 USD, and its all-time low was 5.78 USD and was reached on Oct 4, 2011. View more price dynamics on DLMAF chart.
See other stocks reaching their highest and lowest prices.
See other stocks reaching their highest and lowest prices.
DLMAF stock is 0.86% volatile and has beta coefficient of 0.24. Track Dollarama, Inc. stock price on the chart and check out the list of the most volatile stocks — is Dollarama, Inc. there?
Today Dollarama, Inc. has the market capitalization of 37.96 B, it has increased by 2.28% over the last week.
Yes, you can track Dollarama, Inc. financials in yearly and quarterly reports right on TradingView.
Dollarama, Inc. is going to release the next earnings report on Mar 24, 2026. Keep track of upcoming events with our Earnings Calendar.
DLMAF earnings for the last quarter are 0.83 USD per share, whereas the estimation was 0.79 USD resulting in a 5.74% surprise. The estimated earnings for the next quarter are 1.03 USD per share. See more details about Dollarama, Inc. earnings.
Dollarama, Inc. revenue for the last quarter amounts to 1.36 B USD, despite the estimated figure of 1.35 B USD. In the next quarter, revenue is expected to reach 1.53 B USD.
DLMAF net income for the last quarter is 229.52 M USD, while the quarter before that showed 232.05 M USD of net income which accounts for −1.09% change. Track more Dollarama, Inc. financial stats to get the full picture.
Yes, DLMAF dividends are paid quarterly. The last dividend per share was 0.08 USD. As of today, Dividend Yield (TTM)% is 0.22%. Tracking Dollarama, Inc. dividends might help you take more informed decisions.
Dollarama, Inc. dividend yield was 0.27% in 2024, and payout ratio reached 8.81%. The year before the numbers were 0.29% and 7.93% correspondingly. See high-dividend stocks and find more opportunities for your portfolio.
As of Feb 14, 2026, the company has 28.4 K employees. See our rating of the largest employees — is Dollarama, Inc. on this list?
EBITDA measures a company's operating performance, its growth signifies an improvement in the efficiency of a company. Dollarama, Inc. EBITDA is 1.56 B USD, and current EBITDA margin is 30.78%. See more stats in Dollarama, Inc. financial statements.
Like other stocks, DLMAF shares are traded on stock exchanges, e.g. Nasdaq, Nyse, Euronext, and the easiest way to buy them is through an online stock broker. To do this, you need to open an account and follow a broker's procedures, then start trading. You can trade Dollarama, Inc. stock right from TradingView charts — choose your broker and connect to your account.
Investing in stocks requires a comprehensive research: you should carefully study all the available data, e.g. company's financials, related news, and its technical analysis. So Dollarama, Inc. technincal analysis shows the buy rating today, and its 1 week rating is buy. Since market conditions are prone to changes, it's worth looking a bit further into the future — according to the 1 month rating Dollarama, Inc. stock shows the buy signal. See more of Dollarama, Inc. technicals for a more comprehensive analysis.
If you're still not sure, try looking for inspiration in our curated watchlists.
If you're still not sure, try looking for inspiration in our curated watchlists.