DOCKUSDT trade ideas


DOCKUSDT Short Time Trade !Hello, dear friends
DOCKUSDT Short Time Trade !
If you like such format of my quick analyzes, support idea with like. I'll try to find more opportunities for making 💰
Always in touch with you🧡
Sincerely Your DrDonIQ
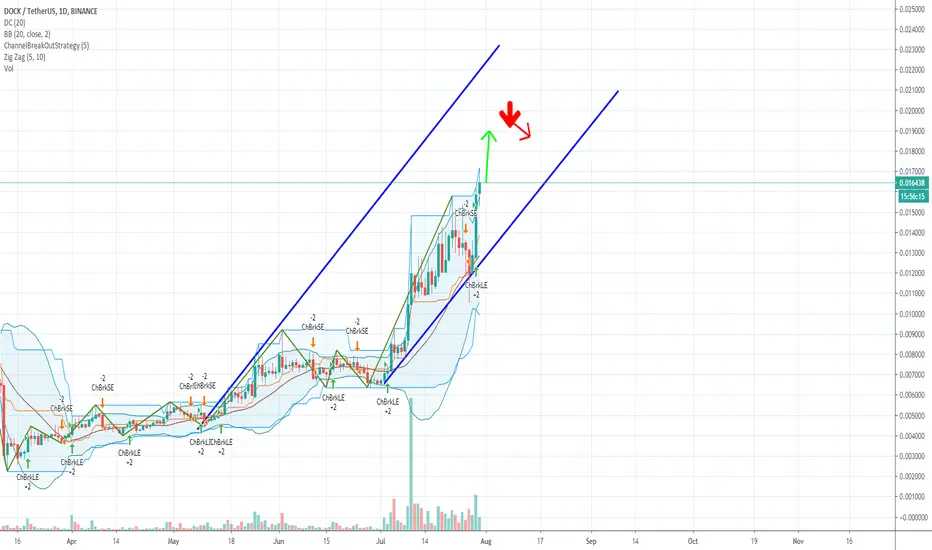
DOCKUSDT ANALYSISActually, we do not guess where the candles go because the candles passed the last resistance line(0.014133).
Therefore, we have only one opportunity now. If we buy it, we should watch carefully and look at EngineeringRobo's signals.
If you wanna information about EngineeringRobo please let me know.


DOCK/USDTHello friends
According to the analysis I have done for this currency, I expect the price trend to finally reach the targets that I have set for it in another week.
Be happy and victorious


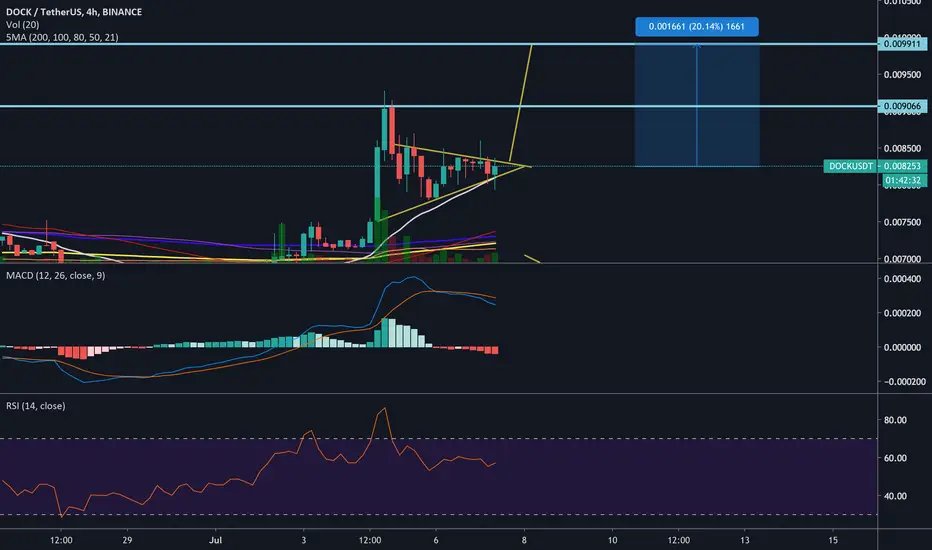
DOCKUSDTDOCKUSDT, the trend has been increasing and it goes up the resistance line.
- If it hits the resistance line above, wait for an open-close candle then buy! (if you like to take a risk, it is also a good time to buy some!)
- If it goes down, keep your eyes on the support line and the uptrend line, wait for an open-close candle below them and then sell.
According to EngineeringRobo's signals, the future is bright!

Proyección en DOCKSeguimos poniendo a prueba continuidad de tendencias.
Tendencia alcista y luego de eso:
Fallo de máximos, ruptura de la línea de directriz pero no hubo ruptura de la zona de control.
Nuevamente movimiento lateral lo que podría darnos continuación de la tendencia alcista y marcar así nuevos máximos.
Proyecciones a corto, mediano y largo plazo.


DOCKUSDT formed bullish Cypher | Upto 29% Bullish Move ExpectedOn 8th Oct I posted a trade plan where on 2 hour based chart the Dock token was completing bullish Shark pattern then finally as per prediction the priceline entered in buying zone and hit the sell targets.
Formation of new harmonic Cypher pattern:
Now this time on 12 hour chart the price action of Dock token has formed bullish harmonic Cypher pattern and buying zone.
Buying And Sell Targets:
The buying and sell targets according to harmonic Cypher pattern should be:
Buy between: $0.004333 to $0.004016
Sell between: $0.004583 to $0.005187
Stop Loss:
The potential reversal zone area which is up to $0.004016 can be used as stop loss in case of complete candle sticks closes below this level.
Possible profit and loss ratio:
As per above targets this short term trade has the profit possibility of 29% and as per above mentioned stop loss, the loss possibility is 7%.
Note: This idea is education purpose only and not intended to be investment advice, please seek a duly licensed professional and do you own research before any investment.

DOCK USDT #DOCKUSDT (Short Term)
Buy: 0.00403100 - 0.00382945
Target 1: 0.00415193
Target 2: 0.00431317
Target 3: 0.00463565
Target 4: 0.00524030
Target 5: 0.00604650
Stoploss: 0.00373371
Invest: 3%
Risk/Reward: 5% / 54%

DOCKUSDT forming bullish BAT | A buying opportunity aheadPriceline of Dock / US Dollar is forming a bullish BAT pattern and soon it will be entered in potential reversal zone insha Allah.
Do use the potential reversal zone as stop loss in case a candle stick closes below this PRZ area.
I have defined targets using Fibonacci sequence as below:
Buy between: 0.010223 to 0.010143
Sell between: 0.010412 to 0.010696
Regards,
Atif Akbar (moon333)

DOCk Resistance #DOCK #DOCKUSD #DOCKUSDT nice wick here above resistance that has been tested multiple times. Let's see if we can get a flip here to support with a nice retest.
Marc

DOCKUSDTit completed the BAT harmonic pattern. so you can buy it. this analysis is valid to 29 oct 2019. for trader how in low risk I suggest setting a buy stop order that show in my analysis.
Good trade EK_Analysis


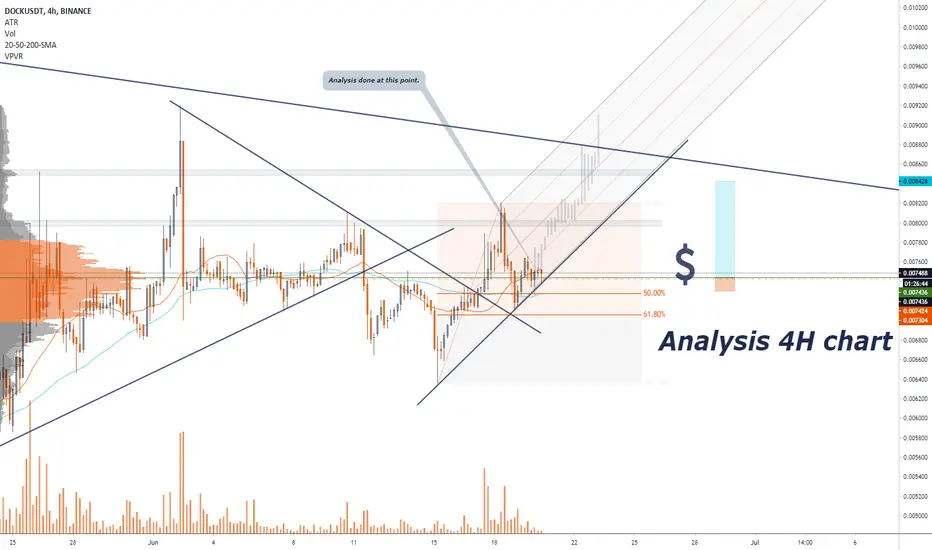
DOCK / DOCKUSDT / Daily / Technical Chart
Formation: Resistance Channel
Risk Management: 2%
Wish you many pips
PS: Thank you very much that you support me with your likes and Comments
If you have another analysis at this pair, please share in comments, I will be glad to discuss with you.
FxCanli Volume Indicator:

DOCKUSDT formed bullish Shark | A buying opportunityPriceline of DOCK / Tether US has formed a bullish Shark pattern and entered in potential reversal zone.
This PRZ area should be used as stop loss in case of complete candle stick closes below this zone.
Volume profile is showing less interest of traders at PRZ level but MACD is strong bearish and Stochastic is in bear cross so for secure trade we can wait for MACD to turn weak bearish or for stochastic to give bull cross then buy.
I have used Fibonacci sequence to set the targets:
Buy between: 0.010749 to 0.010537
Sell between: 0.010943 to 0.011370
Regards,
Atif Akbar (moon333)

