DOGELooks to be putting in that retest of .16 support
Would love to see this hold and run highs next
DOGEUSD.P trade ideas

$DOGEUSDNot financial advice.
COINBASE:DOGEUSD
Weekly candle chart.
Possible in the making of a cup and handle. For those familiar with the STRAT if it breaks pass the first yellow line will flip the previous year. Bulls need to be ready for that.
Like and follow for more ideas.
Thanks.

Potential bullish rise?DOG/USD has just bounced off the support level which is an overlap support that is slightly above the 50% Fibonacci retracement and could rise to our take profit.
Entry: 0.1564
Why we like it:
There is an overlap support level which is slightly above the 50% Fibonacci retracement.
Stop loss: 0.1482
Why we like it:
There is a pullback support level.
Take profit: 0.1729
Why we like it:
There is a pullback resistance level.
Please be advised that the information presented on TradingView is provided to Vantage (‘Vantage Global Limited’, ‘we’) by a third-party provider (‘Everest Fortune Group’). Please be reminded that you are solely responsible for the trading decisions on your account. There is a very high degree of risk involved in trading. Any information and/or content is intended entirely for research, educational and informational purposes only and does not constitute investment or consultation advice or investment strategy. The information is not tailored to the investment needs of any specific person and therefore does not involve a consideration of any of the investment objectives, financial situation or needs of any viewer that may receive it. Kindly also note that past performance is not a reliable indicator of future results. Actual results may differ materially from those anticipated in forward-looking or past performance statements. We assume no liability as to the accuracy or completeness of any of the information and/or content provided herein and the Company cannot be held responsible for any omission, mistake nor for any loss or damage including without limitation to any loss of profit which may arise from reliance on any information supplied by Everest Fortune Group.

DOGEDOGE has yet to see its move compaired to other memes that have been seeing major gains. Doge has a chance to see a breakout with some positive price action from these levels. If this support doesnt hold doge could possibly go much lower.

Elliott Wave Modern Analysis: Major Bullish Trends Unveiled!Hello traders! 📈✨ Today, we're diving into a comprehensive Elliott Wave Modern analysis on the DOGEUSD weekly chart (W1). With our two-window setup, we are comparing the current market behavior with a historical bullish trend from December 14, 2020, to May 3, 2021. Let's break it down:
Right Window Analysis:
Period: December 14, 2020 - May 3, 2021
Market Behavior: During this period, DOGEUSD exhibited a massive bullish trend forming an ABC flat pattern.
Key Levels:
Wave A: $0.4530, representing a 500% increase from a lower degree abc Zigzag (marked in grey).
Left Window Analysis:
Current Status: The market is currently forming the early stages of a three-wave pattern (a:3 & b:3).
Future Projection:
- If history repeats, we might see wave c:5 with a potential 500% increase, targeting $0.7992 from the height of a:3.
- Current Price: $0.1650
- Target: Watch for the first major peak around $0.7992!
🚨 Get ready for a potential bullish surge in DOGEUSD! 🚨 With these insights, we could be on the brink of another significant move. Stay tuned and trade wisely! 🚀💸
🔗 Follow for more updates and detailed analyses! 📊📌
#ElliottWaveModern #CryptoAnalysis #DOGEUSD #TechnicalAnalysis #BullishTrends #CryptoTrading #TradingView 🚀📈🌊

Doge IdeaJust something I noticed.
Lets hit the play button in a month and see if I was right.
RSI on weekly chart crossing over too.
Tends to have large upswings of 40%+ when weekly crosses.
Thank you.


RSI Divergence: BTC, not DOGEHello,
I believe this may be a significant RSI divergence on BTC, which DOGE is showing Congruence on.
This is illustrated by the slope of the peaks of the RSI (top), and you can see the White arrows show the corresponding peaks of the price action.
A classic Bearish Divergence is illustrated in BTC (right side).
I do believe there can and will be a massive transfer of wealth from the old king to the coin that illicit the emotion of LOVE. There is something powerfully different about that, as the planet is transitioning out of the 3D reality ruled by Fear, and into the 5D reality where the force of Love dominants.
Good luck, God Speed, Love and Light to All!

DOGE - Bearish Rising Wedge v Bullish Retracement LevelStrong potential for a Rising Wedge Correction after breaking past and building some support at our .236 (.1528) and .382 (.1619) neckline over the last 3 weeks. A break past .1621 turns that .382 support into resistance as we keep an eye on our EMA's here, looking at our 10,20,50 pointing down past our 200 as confirmation on our 1hr charts. Longer term we are hovering around our .618 retracement (.1646) from March that gives us some alternative support for a continued uptrend fighting at our mid-April .618 retracement pushing for a bearish reversal around .1768.

DOGEUSD: getting a bit dodgy The reversal from May 1st started impulsive then not sure what happened. It is possible that price action from May 13th is some kind of a leading diagonal structure of a lower degree wave 1, but it is taking too long to stay as a lower degree structure. At this point we might face the possibility that the minor degree wave 4 correction hasn't completed yet and the recovery so far has only been a B wave. If that is the case, the line on the sand remains at $0.1072 and ideally we do not want to see a daily close below $0.11. Best case scenario we see some more sideways action over the summer to have the structure complete as some kind of a double combo correction and price remains at $0.13. We shall see. What we absolutely do not want is a break below $0.1. If that happens then it will confirm that the intermediate wave 4 hasn't completed yet and price can plunge below $0.04. Right now, not going to think about that calamity. Will keep an eye on the Bollinger bands and MACD. At this point, sideways price action seems most likely.

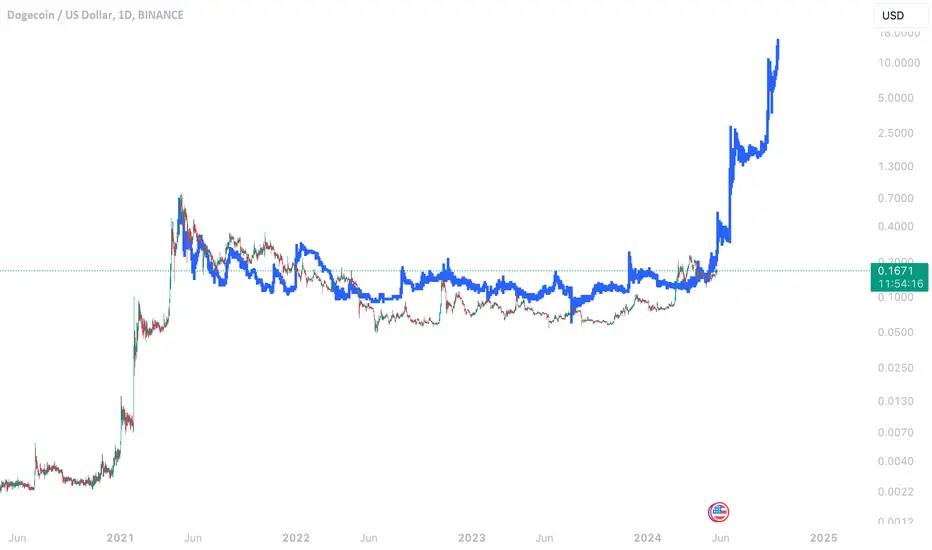
$9 DOGe!hello,
Here is the all time view of DOGE, jsut incase anyone needs a reminder of what he is capable of when he goes on runs.
Relevant projections are fit to the myriad of relevant levels, recreating the future from the recent past. Some of my favorite (psychological) price levels are annotated in red on the right. I’ll be looking for buy and sell opportunities near those levels.
I dont actually think we will make it to $9 on this push… we are already at a lower angle channel than they represented it seems. But, i would love to be proven wrong on that! LFG!
LOVE, DOGe!

Dogecoin Analysis | Overview & Potential Price ScenariosThe 1D TF chart for Dogecoin shows that the price is currently oscillating between significant Fib levels of 0.382 at $0.16154 and $0.17103, which are being tested as support and resistance. Additionally, the price is situated in the middle of the Ichimoku , indicating uncertainty and the potential for sideways movement. Yesterday's candlestick formed an Inverted Hammer Pattern, a Bearish Signal , while today's candlestick is forming a Hammer Pattern, a Bullish Signal , further confirming market uncertainty. Key support and resistance levels play a crucial role in determining the future direction of the price.
The support level at $0.15313 (0.5 Fib) is critical. If the price falls below this level, further declines to $0.13522 (0.618 Fib) and possibly to $0.1150 can be expected. It is crucial to monitor trading volumes when these levels are approached or breached to confirm the strength and direction of the price movement.
◼️ Bullish Scenario: If the price breaks and consolidates above the $0.17442 level with confirmation from high trading volumes, it could reach levels of $0.19318 and then $0.20563. Exiting the Ichimoku cloud and increasing volumes will serve as additional indicators of the beginning of a bullish trend.
◼️ Bearish Scenario: A bearish scenario is likely if the price drops below and consolidates under the $0.15313 level. In this case, further declines to $0.13522 and an increased likelihood of establishing a new lower low at $0.11000 become probable, especially if this movement is accompanied by rising selling volumes. Traders should be prepared for potential SHORT positions or exiting LONG positions if a bearish trend is confirmed.
Despite its popularity and active community, Dogecoin lacks unique technological advantages or innovations to support its long-term value. In contrast, crypto like ADA, NEAR, and COTI offer tangible technological solutions and practical applications, ensuring their sustainable growth and industry recognition. Without significant technological advancements and real utility, DOGE's value will rely more on temporary market sentiment rather than a solid foundation for long-term growth.
Conclusion: Overall, the current price situation for DOGE is characterized by uncertainty with potential sideways movement in the short term. A breakout of key support or resistance levels will determine the future price direction. Additionally, the price direction of Bitcoin plays a significant role in establishing the overall trend direction for like DOGE.
Disclaimer: Content for seasoned traders only. Not financial advice. You bear sole responsibility for trading outcomes. ➖ DYOR 🧠 💡

DOGE1. Doge over time
2. plotting tops and bottoms
3. Length between tops and bottoms
4. Consolidation periods
5. Degree to which the peak exceeded the prior peak

Dogecoin: The Lovely Doggo Dogecoin: The Lovely Doggo
It is supported by the curve trend line (Cru) for 222 days. If this trend continues and breaks the $0.176 resistance, we can move up to $0.197 and then after further support from this curved trend line (Cru), breaking the $0.224 resistance, we can consider the final target at $0.3125.
On the other hand, if there is no support and this curve trend line (Cru) disappears, we can correct and even experience a sharp drop. In this case, our targets could be $0.12 and then $0.075.
Beware of this double-edged sword.
All analysis is based on my point of view and this is not economic advice. You must do your due diligence for your own transactions

The king of cryptocurrencies, Bitcoin, its effects on subsetsDear analysts and traders,
I trust this message finds you in good health and high spirits as you prepare to approach the upcoming week with renewed vigor. I extend my best wishes for continued success in all your business pursuits. It is essential to emphasize that sustained success in business hinges significantly on the consistent establishment and adherence to your principles.
As an advocate of the Elliott Wave principle, I regard this methodology as a valuable instrument for market analysis. Over the past three years, I have honed my approach by amalgamating this principle with a meticulous evaluation of diverse market scenarios. I strive to mitigate market uncertainties by upholding a broad spectrum of market perspectives, enabling me to discern market structures with utmost precision.
I am pleased to share my analysis with you, with the disclaimer that I do not offer buy or sell recommendations. My perspective on analytical ideas remains entirely impartial, and if my analysis aligns with your standards, it can serve as a compass for informed decision-making.
I have enclosed my prior analysis of the same market for your perusal and comparison. All aspects of my analysis are clearly delineated for clarity. Nevertheless, familiarity with the Elliott Wave principle theory facilitates comprehension of the analytical concept. I apologize for the repetitive nature of the text, as my week is occupied with formulating analytical and educational ideas, as well as engaging in trading activities and managing my social networks. Due to time constraints, I am unable to provide textual explanations for every idea, hence the inclusion of a separate text alongside the labeling. Should the text be unclear, I am available to elucidate the key points.
My rigorous study of the Elliott Wave Principle spanned nearly three years, during which my grasp and utilization of this invaluable tool evolved. My progress thus far stands as a tribute to the legacy of Ralph Nelson Elliott, whose brilliance underpins my accomplishments. May he rest in peace.
I am grateful for your unwavering support and benevolence, and I eagerly anticipate your feedback and constructive criticism.
May my analysis serve as a valuable asset in your business endeavors, and I remain yours sincerely,
Mr. Nobody
Previous analytical ideas

GiraffeDoge entered Giraffe trend. It seems that she has consumed everything at current position and is on the way to new abundant place.

Could DOG/USD fall further?DOG/USD has reacted off a resistance level which is an overlap resistance that aligns with the 61.8% Fibonacci retracement and could potentially fall to our take profit.
Entry: 0.1612
Why we like it:
There is an overlap resistance level that lines up with the 61.8% Fibonacci retracement.
Stop loss: 0.1696
Why we like it:
There is a pullback resistance level.
Take profit: 0.1479
Why we like it:
There is a pullback support level which lines up with the 78.6% Fibonacci projection.
Please be advised that the information presented on TradingView is provided to Vantage (‘Vantage Global Limited’, ‘we’) by a third-party provider (‘Everest Fortune Group’). Please be reminded that you are solely responsible for the trading decisions on your account. There is a very high degree of risk involved in trading. Any information and/or content is intended entirely for research, educational and informational purposes only and does not constitute investment or consultation advice or investment strategy. The information is not tailored to the investment needs of any specific person and therefore does not involve a consideration of any of the investment objectives, financial situation or needs of any viewer that may receive it. Kindly also note that past performance is not a reliable indicator of future results. Actual results may differ materially from those anticipated in forward-looking or past performance statements. We assume no liability as to the accuracy or completeness of any of the information and/or content provided herein and the Company cannot be held responsible for any omission, mistake nor for any loss or damage including without limitation to any loss of profit which may arise from reliance on any information supplied by Everest Fortune Group.

Dogecoin still looks positiveEASYMARKETS:DOGUSD
Disclaimer:
easyMarkets Account on TradingView allows you to combine easyMarkets industry leading conditions, regulated trading and tight fixed spreads with TradingView's powerful social network for traders, advanced charting and analytics. Access no slippage on limit orders, tight fixed spreads, negative balance protection, no hidden fees or commission, and seamless integration.
Any opinions, news, research, analyses, prices, other information, or links to third-party sites contained on this website are provided on an "as-is" basis, are intended only to be informative, is not an advice nor a recommendation, nor research, or a record of our trading prices, or an offer of, or solicitation for a transaction in any financial instrument and thus should not be treated as such. The information provided does not involve any specific investment objectives, financial situation and needs of any specific person who may receive it. Please be aware, that past performance is not a reliable indicator of future performance and/or results. Past Performance or Forward-looking scenarios based upon the reasonable beliefs of the third-party provider are not a guarantee of future performance. Actual results may differ materially from those anticipated in forward-looking or past performance statements. easyMarkets makes no representation or warranty and assumes no liability as to the accuracy or completeness of the information provided, nor any loss arising from any investment based on a recommendation, forecast or any information supplied by any third-party.

Play Math on DOGE chart!Let's seat and do simple math for DOGE chart since 2017! Numbers don't lie!
2017 - 9346.70% - $0.0002 became $0.0193
2021 - 9427.77% - $0.0081 became $0.7581
2024/5 - 9500 % - $0.0807 will might go to -----> $7.00ish

Doge go go time coming soon. We find out in 4-6 weeks. Doge is looking to consolidate for a few more weeks. Then he wakes up to stretch, walk, run, then teleport to moon. Don’t forget to respect da pump

Doge LongDoge completed a type two bat and after breaking down sprung right back above support.
Now we look for a few things
- Support to Hold
- Divergence to Mature on the 4h & 6h
- Daily MaCD to Stay green
By Layering in you can strategise a SL below Support. We have orders at the 618, 786, & 886.
