$DOGEUSDT sort of pennantTitle, just having some fun with the idea. maybe a nice pennant forming on doge. woof.
DOGEUSDT trade ideas

DOGE ANALYSIS🔮 #DOGE Analysis - Breakout 🚀🚀
💲💲 There is a breakout of Falling Wedge Pattern in #DOGE. It's a 8hr time frame breakout and we will see more higher price after a small retest.
💸Current Price -- $0.1538
📈Target Price -- $0.2226
⁉️ What to do?
- We have marked crucial levels in the chart . We can trade according to the chart and make some profits. 🚀💸
#DOGE #Cryptocurrency #Breakout #DYOR

DOGEUSDT BUY NOW!!!!!!!!DOGEUSD created the wyckoff theory in the 2h time frame now am expecting a purge taking out all the buyside for a liquidity run am taking long from this zone
JOIN AND ENJOY
tell us what you think...........?

DOGEUSD 1DDOGE ~ 1D
#DOGE We found a bullish pattern for the 1D time frame on BINANCE:DOGEUSDT ,
Make purchases after breaking through the resistance line of this pattern or make purchases gradually within this pattern.

DOGEUSDT IDEAHello Trading view Family / Fellow Traders.
I hope you have used and benifited from the previous analysis .
In today trading session we are monitoring DOGEUSDT for a buying opportunity,
DOGEUSDT UPDATE
Seems Like Getting Ready For Another Bullish Wave Formed & Testing Falling Wedge Resistance Incase Of Successful Breakout Expecting Massive Bullish Wave Towards 0.24-0.28$💸🚀

DOGE, Descending channel breakout happening soon...Welcome, Trader. Welcome to our cryptocurrency community! 🚀We are delighted to welcome you, whether you are an experienced trader or a newcomer to cryptocurrency.
We are willing to discuss #DOGE.
DOGEUSDT 🔥🚀.
Update: 💹.
The #DOGE created the descending channel over an 8-hour period ✅.
Breakout confirmation is nearly completed ✅.
After breaking the channel, we will retest for confirmation 💹🚀
If it breaks and closes above this zone, we expect a nearly 37% increase in the medium term. (👉✅).

DOGEUSDT.1DAnalyzing the daily chart for DOGE/USDT, we can see some significant technical details that will aid in identifying potential trading opportunities.
Key Resistance and Support Levels:
Resistance 1 (R1): $0.17386 - This level acts as the first major resistance where the price has previously faced significant sell-offs.
Resistance 2 (R2): $0.21158 - This higher resistance could be the target in a strong bullish momentum scenario.
Support 1 (S1): $0.12157 - Marked by the chart as a critical support level, where buyers have historically shown interest.
Support 2 (S2): Lower than S1, providing a safety net in case of a significant downturn.
Technical Indicators:
Relative Strength Index (RSI): The RSI is currently at 47.59, slightly below the neutral 50 mark, indicating a slight bearish bias in the market.
Moving Average Convergence Divergence (MACD): The MACD line is very close to the signal line but slightly below it, showing a bearish momentum that is not very strong. The MACD histogram is close to zero, suggesting a lack of strong momentum either way.
Trend Analysis:
The price has been following an ascending support trend line, suggesting that as long as this line holds, the bullish sentiment might continue. This trend line acts as a dynamic support, guiding potential rebounds.
Conclusion:
For traders looking at DOGE/USDT, the current setup suggests a cautious approach. With the price nearing the ascending support line, one could consider buying opportunities near this trend line, setting a stop-loss just below it to mitigate potential losses if the trend reverses.
Should the price break below this trend line decisively, it could be an indication of a stronger bearish trend developing, possibly targeting the next support at $0.12157. Conversely, if the price bounces off the support line and moves upward, traders might set their sights on R1 at $0.17386 and potentially R2 at $0.21158 if the momentum is strong enough.
As always, it is advisable to watch how the price reacts at these critical technical levels and to adjust strategies accordingly, keeping an eye on RSI and MACD for any signs of momentum shifts that could provide earlier entries or exits.

DOGEHi guys
Considering the consumption of the specified range, the probability of reaction to the specified price range is very high.
On the higher time frame, the probability that a higher ceiling will be formed compared to the previous ceiling is very weak.
As a result, our bullish view is short-term for now.
What do you think?

DOGEUSDT LONG PROJECTION ✅✔️Price is in a downtrend and we have a breakout and retest to the zone of demand level before we go long, using SMC as confluence; we can also see that we have an imbalance at the demand zone which needs to be filled up, when that is done we go long

$DOGE Inverse Head and Shoulders Forming $0.14-$0.13CRYPTOCAP:DOGE Inverse Head and Shoulders Forming $0.14-$0.13
CRYPTOCAP:DOGE price is flowing lower to shape the right shoulder of an inverse head and shoulders prior to a continuation up. The inverse head and shoulders is a bullish reversal pattern.
If $0.10 breaks then the larger head and shoulders bearish pattern will have the neckjline broken and the price will plummet to $0.10 and more. The regular head and shoulders pattern is bearish. Do your own research.
$DOGE Green means go! Hit $0.15. Next target $0.16+CRYPTOCAP:DOGE Green means go! Hit $0.15. Next target $0.16+
Trend indicator flashes green for uptrend. Next target $0.16+.
Do your own research.

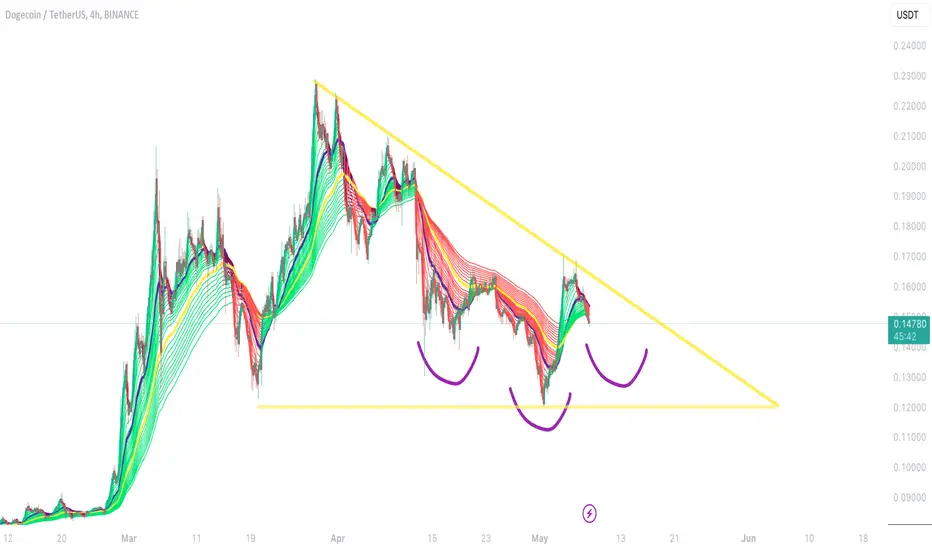
#DOGE Descending Triangle Formation in 1D Timeframe✅ #DOGE Descending Triangle Formation in 1D Timeframe✅
In Case of Breakout, Expecting Bullish Wave. 📈
- High volume area 0.14954.
- Wait for a breakout with huge volume.
- Take confirmation of RSI Divergence.
#DYOR

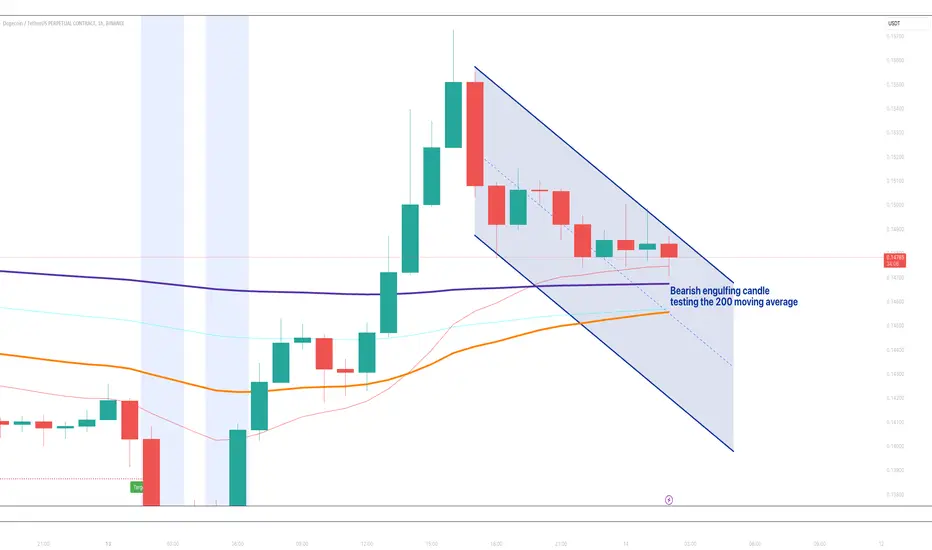
$DOGE Testing 200 EMA CRYPTOCAP:DOGE Testing 200 EMA
It looks like the 200 EMA (dark blue line) is acting like support as a bearish engulfing candle challenges it. If it holds then the rally may continue upward.
Do your own research.
$DOGE Broke out of Falling Wedge Upside Target $0.16CRYPTOCAP:DOGE Broke out of Falling Wedge Upside Target $0.16
The falling wedge has been broken as Dogecoin is rallying toward the target above $0.16+
Do your own research.

DogeusdtDogeusdt is showing bearish divergence and it breaking its Last Hl plus TL
place a sell at CMP as it breaks its Last Hl plus TL

DOGEUSDTNice to meet you. SEOVERIGN - This is SeoVerign.
The point at which the low point formed on May 9 is the time of this counting confirmation.
I hope you have a good result.
- We would like to inform you in advance that SEOVERIGN has nothing to do with the analytical items.

$DOGE Triangle, Bearish Pennant on Lower Timeframe CRYPTOCAP:DOGE Triangle, Bearish Pennant on Lower Timeframe
The lower timeframe 1-hour charts shows a Triangle and Bearish Pennant with targets below. The falling wedge has a higher target above and is most dominant on the higher timeframe as well.
Do your own research.

DOGE Crossroads at $0.177! Discover the Next Move!
DOGE sentiment is neutral in the daily chart and DOGEUSD is teasing the bottom of the range around $0.1423, the key daily support zone.
A bullish break-out of $0.1772 is required for DOGE to turn bullish towards $0.2183 and higher.
A dip to below $0.1423 will lead to more bearishness in the daily chart to $0.1235 and $0.1011.

We are in a trading range and the market is neutralIn this analysis, we first follow the previous scenarios from May 2 until today.
We entered a channel after an upward trend with 170 ascending candles with strong momentum, and after its failure, we entered a trading range.
I have tried to write all the explanations in the chart so that you can easily follow.
After breaking the trading range with a trend-forming gap, we see the price falling with the target of the same trading range.
Since we are about 370 candles in a bearish correction trend, it seems that the previous upward trend has been forgotten and we are waiting for the formation of a new trend.
My entry targets are in the support I specified. And my exit targets are at minor and major resistances, and if I see a strong one-way trend, I will enter the direction of the trade.
In the chart, I have specified a trend line for a one-minute time frame, which is specified in the event of a breakout of the minor resistance target.

$DOGE needs rest to recuperate#doge #dogecoin price structure seems weakened in MID term, not short term. Support zones are given on the chart. NOT FINANCIAL ADVICE.

Doge: primed for 5th wave up?Doge on the weekly has been following a beautiful parabola. Now on the way back up, 4 waves can be counted from an impulse starting in mid October 23 and the 5th appears to be locked and loaded. Should this prove to be the case, the next obvious stop is the 1.618 Fib at around 35 cents. Once there, an ABC correction and possibly further consolidation would make sense.
As always, it's important to remember that BTC determines the alts and BTC is still a risk on trade. Eventually it may become a go to risk off haven like gold, but until that's the case, crypto should be traded with a close eye on Wall St. and BTC. BTC at elevated prices once again also calls for extra caution entering new positions, so stop losses become important.
Not financial advice; trade at your own risk.

$DOGE Bollinger Band Ready to BlowCRYPTOCAP:DOGE Bollinger Band Ready to Blow
The BB is so tight, it must break out. Looks green to me.
Do your own research.

$DOGE Spring is Green CRYPTOCAP:DOGE Spring is Green
The GC is turning green and upside is magnetic.
Do your own research.
