TURBOUSDT Don't miss the flightIs another currency like bonk coming
Yes
Turbo does not travel to the moon
But
It will go to Mars
Community Verified icon
DOGEUSDT trade ideas

$DOGE Similar price action repeats, next leg up loadingCRYPTOCAP:DOGE Similar price action repeats
Rally approx. 6 weeks, retrace approx. 4 weeks, sideways consolidation 6 weeks then rally again. Next leg up loading. Do your own research

DOGEUSDT.1DLooking at the daily chart for DOGE/USDT, I'll provide a detailed technical analysis, highlighting the important trends and indicators that may influence trading decisions.
Key Resistance and Support Levels:
Resistance 1 (R1): $0.17386 - This level has previously acted as both support and resistance, indicating its significance.
Resistance 2 (R2): $0.21158 - A higher resistance point that would require a strong bullish push to breach.
Support 1 (S1): $0.12157 - A critical support level where buying interest previously emerged, potentially halting a further decline.
Technical Indicators:
Relative Strength Index (RSI): The RSI is at 46.92, which is below the neutral 50 mark but not yet in the oversold territory. This suggests there's still some bearish sentiment, but we could be approaching a region where buyers might start to see value.
Moving Average Convergence Divergence (MACD): The MACD line is below the signal line, and both are trending downward, suggesting ongoing bearish momentum. The histogram also shows a negative value, which supports the bearish outlook.
Trend Analysis:
The chart shows a clear downtrend, indicated by lower highs and lower lows. This trend suggests a bearish sentiment prevailing in the market. However, the price approaching S1 could be crucial as this level has historically provided support.
Conclusion:
The DOGE/USDT market appears to be in a bearish phase, as suggested by both the price action and the technical indicators. Traders might consider looking for potential short positions as the price approaches resistance levels R1 and R2, with stops just above these levels to protect against potential breakouts to the upside.
Conversely, if the price reaches S1 and shows signs of stabilization or reversal (e.g., bullish candlestick patterns or RSI moving back above 50), it could present a buying opportunity. Given the current downward trend, any buys should be approached with caution, keeping an eye on the MACD for any signs of a bullish crossover which might suggest a change in momentum.
In essence, the current market setup suggests a bearish trend with potential buying opportunities at major support levels, provided there are confirmatory signals from other technical indicators.

I don't see any good reason or point to buyI have never traded shitcoin
but if I wanted to, I would sell here or wait

I don't see any good reason or point to buyI have never traded shitcoin
but if I wanted to, I would sell here or wait

💎 DOGECOIN (DOGE) - Investment Opportunity (READ THE CAPTION)Upon reviewing the #Dogecoin chart on a weekly (logarithmic) timeframe, we can see that last week the price dropped to the demand level of $0.12 and then encountered buying pressure, managing to rise by more than 40% to $0.17. Currently, this cryptocurrency is trading around $0.148 and I expect further growth in the medium and long term. The upcoming price targets, in order, are $0.229, $0.35, $0.374, and $0.75. The expected long-term yield of this cryptocurrency is above 300%!
Please support me with your likes and comments to motivate me to share more analysis with you and share your opinion about the possible trend of this chart with me !
Best Regards , Arman Shaban

DOGEUSDT#DOGE CRYPTOCAP:DOGE chart update: We've established support above the resistance and completed the downward retest. The scenario I anticipated is unfolding as shown in the chart. Let's see how it goes.

Lingrid | DOGEUSDT rolled back to RANGE zoneThe price perfectly fulfilled my last idea. BINANCE:DOGEUSDT formed a double top at the channel top, then rolled back to the support level at 0.14. On the weekly timeframe, it created a long-tailed bar, which indicates buying pressure. The market might retest 50%–61.8% of the weekly candle. If the price bounces off through the support zone at 0.13-0.14, we can anticipate a bullish move, updating the higher highs. On the daily timeframe, the market formed an inside bar pattern, and currently it's near the Saturday low zone, where we had a price surge. My goal is resistance at 0.16660
Traders, if you liked this idea or if you have your own opinion about it, write in the comments. I will be glad 👩💻

DOGE to the moon?Tesla announcing DOGE as new payment method? Is Elon narratives coming back?
Meme season has been the main cycle trend
Let's take a look at DOGE on 2H timeframe for potential trade setup.
DOGE surged for almost 42% from the lows sweeping those highs resting at .17
However, we can see that we already filled 50% of the wick created from the up move.
The local support that needs to hold is .157, lose this level then we might revisit .15 to .148

$DOGE short term trade idea LONGCRYPTOCAP:DOGE hints at an impulsive 5-wave Elliott Wave structure since the May 1st lows.
RSI divergence on the chart potentially confirms Wave 5 of 3 of 1.
Limit Entry: 0.1545
Stop Loss: 0.1440
Take Profit 1: 0.1617
Take Profit 2: 0.1794
Risk 0.5%
Remember: Do your own research before making trading decisions. This is not financial advice.

DOGECOIN (DOGEUSDT): Next Target $0.19007, Time To Buy!?The price of DOGE surpassed the dynamic resistance in the 4-hour time frame and reached the resistance range of $0.1721-$0.1654, but was unable to break through and subsequently dropped back to the dynamic resistance.
It is expected that the price will increase once more, with the initial goal being to surpass the resistance level, potentially leading to a rise up to $0.19007.

Dogecoin DOGE Intraday Trade SetupDogecoin is dealing with the key intraday resistance zone around $0.1596 and declining as per CRYPTOLEAN forecast.
A bullish break-out of $0.1596 will offer more upside towards $0.1813 and, possibly, higher to $0.20.
Another re-test of $0.1503 or even better $0.1411 followed by a bullish rejection and a break-out of $0.1596 will lead DOGE price to $0.1813 and, possibly, higher to $0.20.
More details are in the signature.

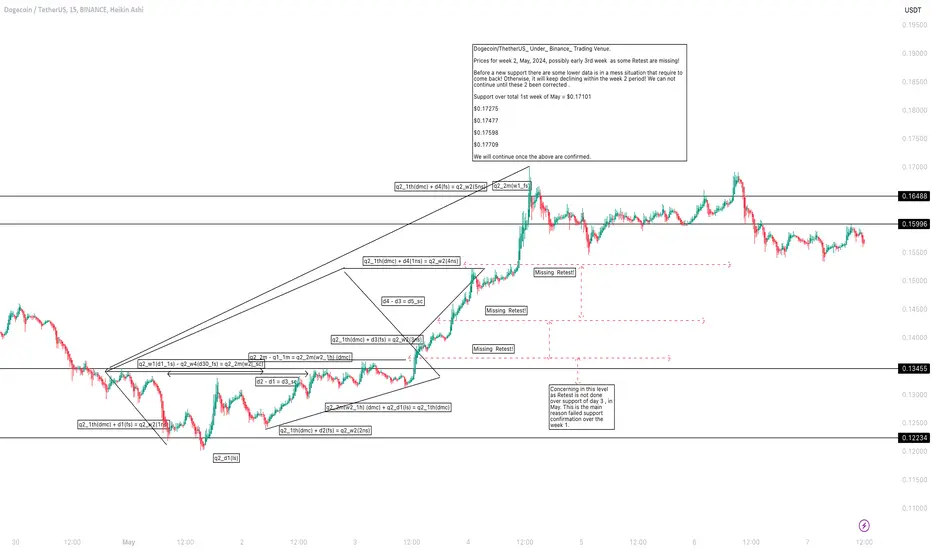
Dogecoin/ThetherUS_ Under_ Binance_ Trading Venue. Dogecoin/ThetherUS_ Under_ Binance_ Trading Venue.
Prices for week 2, May, 2024, possibly early 3rd week as some Retest are missing!
Before a new support there are some lower data is in a mess situation that require for the price to come back! Otherwise, it will keep declining within the week 2, May, 2024 ! We can not continue until these 2 been corrected .
Support over total 1st week of May = $0.17101
$0.17275
$0.17477
$0.17598
$0.17709
We will continue once the above are confirmed.
dogeIn the short term, we have a small support in the green box, which in case of failure will become a resistance, and it is possible to buy in the lower green lines for a short period and take a swing. But it is important that the green box is broken. And if we don't fail, we will be circulating in the orange box

DOGEUSDTWe can attempt to buy DOGEUSDT at breakout of LH (also parallel channel support , Bullish Bat Pattern , bullish divergence on 1 hour timeframe occur indicate that it will move upward)
SL , TP mention in chart.

$DOGE Testing 50/200 EMA in Bull Flag Formation CRYPTOCAP:DOGE Testing 50/300 EMA in Bull Flag Formation
It appears that CRYPTOCAP:DOGE is testing the 50/200 EMAs within a diagonal range between $0.1455-$0.1685. Upon breakout upward next stop is $0.1850. Lower support rests at $0.1400. Breakout, retest, continuation?
Do you own research.

Dogeusdt Dogeusdt is showing bearish divergence and it breaking its Last Hl plus TL
place a sell stop at 0.15203 as it breaks its Last Hl plus TL

Long trade Mon 6th May 24
7.00pm
London Session
Entry 0.16177
Profit level 0.20152 (24.57%)
Stop level 0.15743 (2.68%)

Doge Intraday Trade SetupThe chart highlights breakout/rejection points, criteria, and targets to execute on the trade opportunity.

Long trade
Mon 6th May 24
5.00am
London Session
Entry 0.16822
Profit level 0.20117 (19.59%)
Stop level 0.16149 (4.0%)

DOGECOIN - BULLISH SCENARIO 🚀Hello Traders !
On Saturday 4 May, The DogeCoin Reached The Support Level (0.12253 - 0.13024).
Let's Expect The Bullish Scenario:
if The Price Breaks and Closes Above The Lower High,
We Will See a Bullish Move 📈
__________
TARGET: 0.19900🎯

#DOGE/USDT is trying to break the Diagonal Trendline in 4-Hour T#DOGE/USDT is trying to break the Diagonal Trendline in 4-Hour TF!
CRYPTOCAP:DOGE is testing major resistance level of PWH $0.16465, Wait for BO to open a long position. The major support level is PWH $0.14225.

The big Pump is coming "DOGE"Hello my friend
Be sure to have Dogecoin in your wallet
Soon we will hear a lot of news about this currency
The price of this currency will soon exceed the previous ceiling
Let's go
