DOT / USDT : Momentum building for a strong rallyDOT/USDT is showing strong momentum and looks ready for a rally. If momentum continues to build, the next upside targets are $5 – $6.
Always manage risk and wait for confirmation before entering.
Related pairs

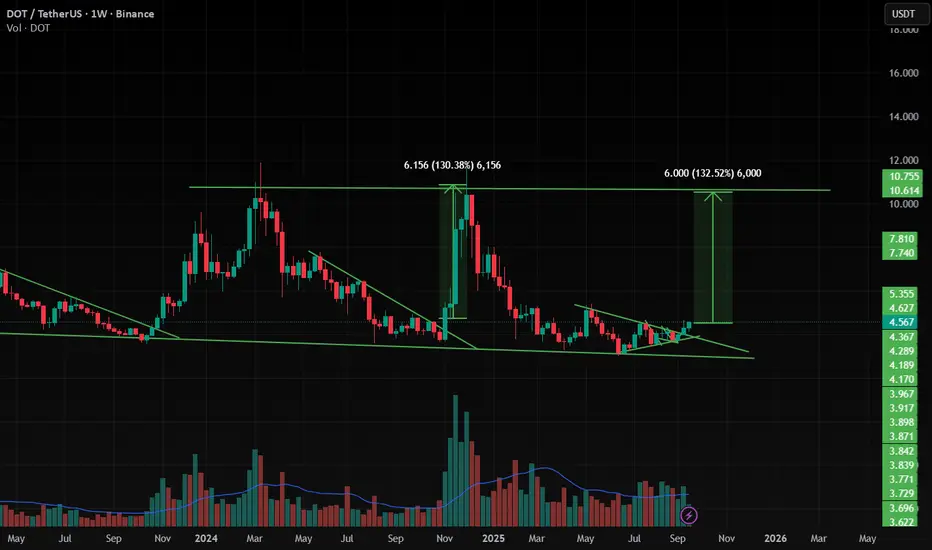
polkadot bullrun expected pricePolka Dot is holding it's support on weekly timeframe. First attempt to break local resistance is already happened. We are expected Dot ETF also which can drive it price at least 2x.

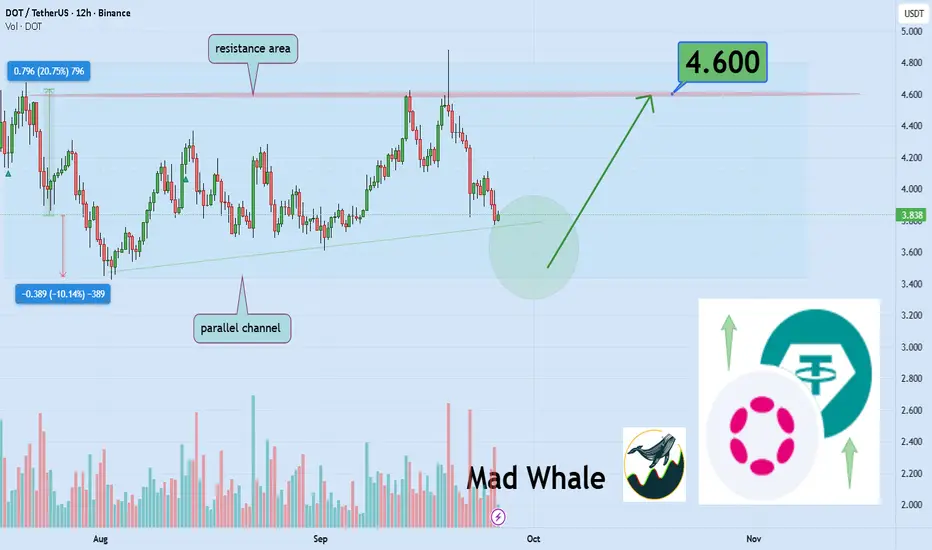
Polkadot testing strong support, potential 20% upside to 4.60Hello✌️
Let’s analyze Polkadot’s price action both technically and fundamentally 📈.
🔍Fundamental analysis:
Polkadot (DOT) is rolling out the JAM upgrade in Q4 2025, aiming for 1M TPS and stronger scalability for apps and enterprises.
With supply capped at 2.1B and inflation reduced, DOT coul
Polkadot Range-Bound Between Weekly Levels, POC Acts as MagnetPolkadot continues to trade between weekly support at $3.39 and resistance at $4.40. Price action remains rotational within this range, with the point of control acting as the primary magnet.
Polkadot’s price has been consolidating for an extended period within a defined weekly range. After multipl

DOTUSDT - 200% Upside - Long SetupDOTUSDT has been in a long consolidation. A bullish divergence was there and now a wedge pattern was in play and finally a bullish breakout and retest could be observed. This would mean a trend reversal and further Higher Highs and Higher Lows. Therefore, giving the perfect opportunity for a long en

DOT is Ready for 130% Up Move DOT is making a pattern at Support zone and It has given a Breakout from that pattern . and at the same time Altcoin Season Index is at 74 , when it is >75 it is sign of very bullish in altcoins and Breakouts will have very high potential to give a big move .
and at the same time Bitcoin dominance
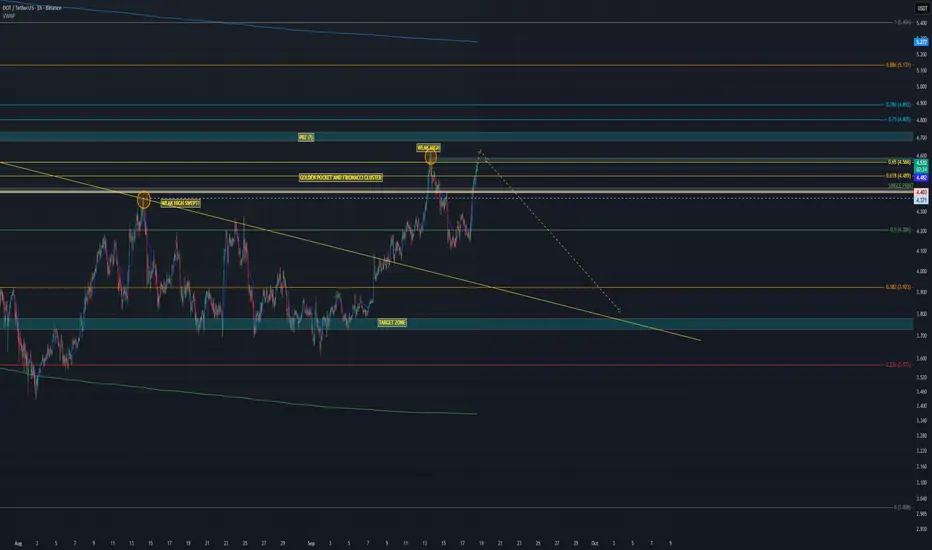
WHAT GOES UP, MUST COME DOWN – $DOT DUMP TIME?In my last analysis we nailed the move: CRYPTOCAP:DOT pumped to sweep the weak 14 Aug high exactly as projected. ✅ That mission is complete – now it’s time for the other side of the trade.
Analysis
14 Aug high swept → equilibrium reached.
Price in HTF Golden Pocket + strong Fib cluster.
B
POLKADOT TO $25Now that we know an altseason is on the way, I think this time Polkadot can break through the $10 resistance.
The next important and strong resistance is at $25, which is a resistance area and the 0.702 of the Fibonacci.

$DOT clean ENTRY on daily candle CLOSE above $4.70CRYPTOCAP:DOT on the DAILY chart still under that long-term horizontal resistance up there at $4.60 - $4.70 which is also now the upper trendline of our ASCENDING TRIANGLE that has been forming since late June.
Same strategy, entries above $4.7 with a good daily candle close. Also about to materia

Dot/Usdt
Polkadot cryptocurrency is worth buying at the price of $3.80, with a stop-loss at $3.40 and a target price of $4.80. It could potentially experience around 30% price growth from now.

See all ideas
Summarizing what the indicators are suggesting.
Oscillators
Neutral
SellBuy
Strong sellStrong buy
Strong sellSellNeutralBuyStrong buy
Oscillators
Neutral
SellBuy
Strong sellStrong buy
Strong sellSellNeutralBuyStrong buy
Summary
Neutral
SellBuy
Strong sellStrong buy
Strong sellSellNeutralBuyStrong buy
Summary
Neutral
SellBuy
Strong sellStrong buy
Strong sellSellNeutralBuyStrong buy
Summary
Neutral
SellBuy
Strong sellStrong buy
Strong sellSellNeutralBuyStrong buy
Moving Averages
Neutral
SellBuy
Strong sellStrong buy
Strong sellSellNeutralBuyStrong buy
Moving Averages
Neutral
SellBuy
Strong sellStrong buy
Strong sellSellNeutralBuyStrong buy
Displays a symbol's price movements over previous years to identify recurring trends.
Frequently Asked Questions
The current price of DOT3xShort/Tether (DOT) is 3.040 USDT — it has risen 0.81% in the past 24 hours. Try placing this info into the context by checking out what coins are also gaining and losing at the moment and seeing DOT price chart.
DOT3xShort/Tether price has risen by 31.91% over the last week, its month performance shows a −25.03% decrease, and as for the last year, DOT3xShort/Tether has increased by 4.04 K%. See more dynamics on DOT price chart.
Keep track of coins' changes with our Crypto Coins Heatmap.
Keep track of coins' changes with our Crypto Coins Heatmap.
DOT3xShort/Tether (DOT) reached its highest price on Aug 2, 2025 — it amounted to 6.646 USDT. Find more insights on the DOT price chart.
See the list of crypto gainers and choose what best fits your strategy.
See the list of crypto gainers and choose what best fits your strategy.
DOT3xShort/Tether (DOT) reached the lowest price of 0.000194 USDT on Apr 3, 2021. View more DOT3xShort/Tether dynamics on the price chart.
See the list of crypto losers to find unexpected opportunities.
See the list of crypto losers to find unexpected opportunities.
The safest choice when buying DOT is to go to a well-known crypto exchange. Some of the popular names are Binance, Coinbase, Kraken. But you'll have to find a reliable broker and create an account first. You can trade DOT right from TradingView charts — just choose a broker and connect to your account.
Crypto markets are famous for their volatility, so one should study all the available stats before adding crypto assets to their portfolio. Very often it's technical analysis that comes in handy. We prepared technical ratings for DOT3xShort/Tether (DOT): today its technical analysis shows the buy signal, and according to the 1 week rating DOT shows the strong buy signal. And you'd better dig deeper and study 1 month rating too — it's buy. Find inspiration in DOT3xShort/Tether trading ideas and keep track of what's moving crypto markets with our crypto news feed.
DOT3xShort/Tether (DOT) is just as reliable as any other crypto asset — this corner of the world market is highly volatile. Today, for instance, DOT3xShort/Tether is estimated as 2.25% volatile. The only thing it means is that you must prepare and examine all available information before making a decision. And if you're not sure about DOT3xShort/Tether, you can find more inspiration in our curated watchlists.
You can discuss DOT3xShort/Tether (DOT) with other users in our public chats, Minds or in the comments to Ideas.