Polkadot (DOT): Waiting For Market Structure Break | BullishKeeping eyes on the local bottom on DOT, where we are expecting to see a decent support to establish, which hopefully would push price up towards a proper market structure break.
If this scenario were to play out, this would be an ideal entry for a short-term long position.
For now we just wait!
Related pairs

DOT: nearing capitulation? key levels and targets for todayDOT is bleeding again, but are we close to the capitulation wick everyone is hunting for? Lately, according to market chatter, capital keeps rotating into majors and away from smaller L1s, so DOT is drifting with almost no fresh buyers. On the chart that turns every bounce into a sell opportunity so

DOTUSDT 1,315% profits potential 5X leverage —LONG tradeIt only happens once or twice per year. This year it is likely we get two opportunities to go LONG starting from a major bottom. Only twice in the whole of 2026.
We will have only one opportunity to SHORT from a major high point. After this bullish wave is over, we will have a very strong correctio

Polkadot (DOT): 3 Trading Setups Are Ready | Now We WaitDOT is sitting in a key area right now. After the doomsday dump, price found a local bottom and started stabilizing. We have two clear scenarios here: either a clean break below local lows for a short, or a reclaim higher that opens a long toward the upper range.
Both sides make sense from an R:R p

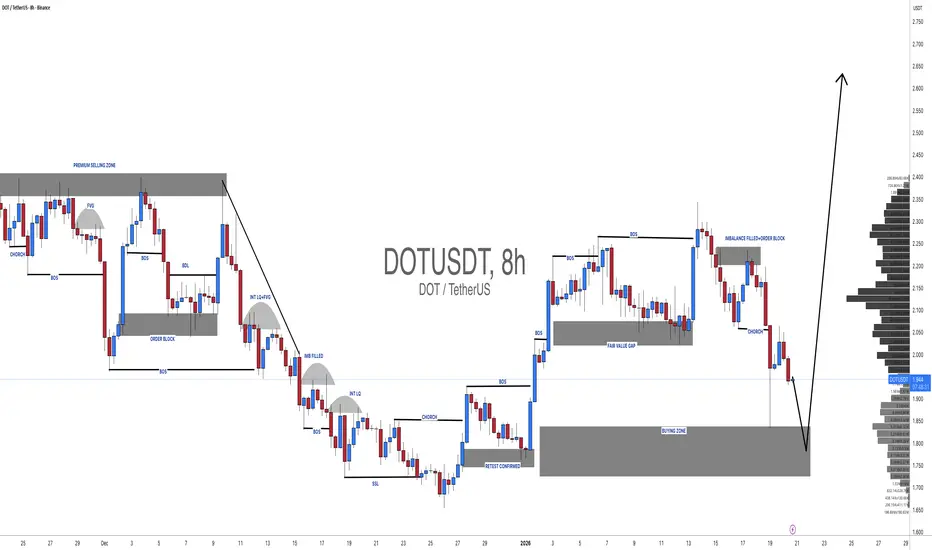
DOT: Set To BounceDOT is entering its buying zone .
From the Daily pov DOT should be heading to the upper side liquidation zone.

#DOT/USDT Ready to go higher#DOT
The price is moving within a descending channel on the hourly timeframe. It has reached the lower boundary and is heading towards a breakout, with a retest of the upper boundary expected.
The Relative Strength Index (RSI) is showing a downward trend, approaching the lower boundary, and an upw

Polkadot (DOT) – Macro Reversal (3D Timeframe)hi traders
This technical analysis evaluates the 3-day (3D) chart of Polkadot (DOT), identifying a potential macro bottom and a long-term recovery setup.
1. Technical Setup: The Falling Wedge
The most prominent feature of this chart is the massive Descending Wedge (Falling Wedge) structure that h

DOTUSDT: One Last Drop And Then Strong Bullish Move To Start?Dear Traders,
DOTUSDT is poised for a strong bullish reversal, potentially reaching all-time highs. Both fundamental and technical analysis support our bullish bias, but we need strong bullish volume to confirm this view. If you enjoy our work, please like and comment for more.
Team Setupsfx_
Trend Continuation DOTDOT - Trend Continuation Setup
In my previous post, I outlined the primary scenario in which we had already seen an A- and B-wave, followed by a C-wave completing within the 23.6% to 38.2% Fibonacci retracement zone.
This scenario has now played out as expected.
From the bottom of the (C)-wave, I

DOT///LONG///NO LEVERAGE/// 200% TARGETHello. DOT should find bottom soon, and reverse to up trend. 5$ to 7$ for DOT target.

See all ideas
Summarizing what the indicators are suggesting.
Oscillators
Neutral
SellBuy
Strong sellStrong buy
Strong sellSellNeutralBuyStrong buy
Oscillators
Neutral
SellBuy
Strong sellStrong buy
Strong sellSellNeutralBuyStrong buy
Summary
Neutral
SellBuy
Strong sellStrong buy
Strong sellSellNeutralBuyStrong buy
Summary
Neutral
SellBuy
Strong sellStrong buy
Strong sellSellNeutralBuyStrong buy
Summary
Neutral
SellBuy
Strong sellStrong buy
Strong sellSellNeutralBuyStrong buy
Moving Averages
Neutral
SellBuy
Strong sellStrong buy
Strong sellSellNeutralBuyStrong buy
Moving Averages
Neutral
SellBuy
Strong sellStrong buy
Strong sellSellNeutralBuyStrong buy
Displays a symbol's price movements over previous years to identify recurring trends.
Frequently Asked Questions
The current price of DOT / UST (DOT) is 1.29100000 USDT — it has risen 0.37% in the past 24 hours. Try placing this info into the context by checking out what coins are also gaining and losing at the moment and seeing DOT price chart.
DOT / UST price has fallen by −14.10% over the last week, its month performance shows a −37.94% decrease, and as for the last year, DOT / UST has decreased by −73.46%. See more dynamics on DOT price chart.
Keep track of coins' changes with our Crypto Coins Heatmap.
Keep track of coins' changes with our Crypto Coins Heatmap.
DOT / UST (DOT) reached its highest price on Aug 18, 2020 — it amounted to 349.00000000 USDT. Find more insights on the DOT price chart.
See the list of crypto gainers and choose what best fits your strategy.
See the list of crypto gainers and choose what best fits your strategy.
DOT / UST (DOT) reached the lowest price of 0.11000000 USDT on Oct 10, 2025. View more DOT / UST dynamics on the price chart.
See the list of crypto losers to find unexpected opportunities.
See the list of crypto losers to find unexpected opportunities.
The safest choice when buying DOT is to go to a well-known crypto exchange. Some of the popular names are Binance, Coinbase, Kraken. But you'll have to find a reliable broker and create an account first. You can trade DOT right from TradingView charts — just choose a broker and connect to your account.
Crypto markets are famous for their volatility, so one should study all the available stats before adding crypto assets to their portfolio. Very often it's technical analysis that comes in handy. We prepared technical ratings for DOT / UST (DOT): today its technical analysis shows the sell signal, and according to the 1 week rating DOT shows the sell signal. And you'd better dig deeper and study 1 month rating too — it's sell. Find inspiration in DOT / UST trading ideas and keep track of what's moving crypto markets with our crypto news feed.
DOT / UST (DOT) is just as reliable as any other crypto asset — this corner of the world market is highly volatile. Today, for instance, DOT / UST is estimated as 0.89% volatile. The only thing it means is that you must prepare and examine all available information before making a decision. And if you're not sure about DOT / UST, you can find more inspiration in our curated watchlists.
You can discuss DOT / UST (DOT) with other users in our public chats, Minds or in the comments to Ideas.