$DOT WEEKLY CHART UPDATE #DOT is showing a strong long-term CRYPTOCAP:DOT WEEKLY CHART UPDATE
CRYPTOCAP:DOT is showing a strong long-term accumulation pattern around the $3-4 zone. This level has acted as a solid historical support since 2022. If it holds, we could see a major reversal ahead with potential upside targets around $10–$20 by 2026.
The structure looks bullish, and early accumulation here could pay off big in the next cycle. 🚀
Trade ideas

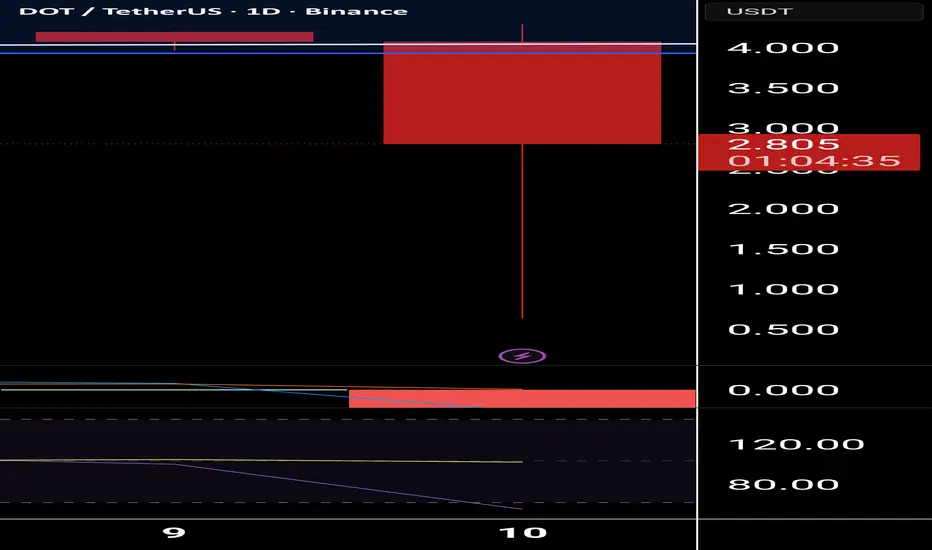
Dot What just happened? Does anyone know what just happened?
Also could either be the start of the Bull run for this coin or its demise? Be safe guys, I just lost a lot on this one, At the moment.
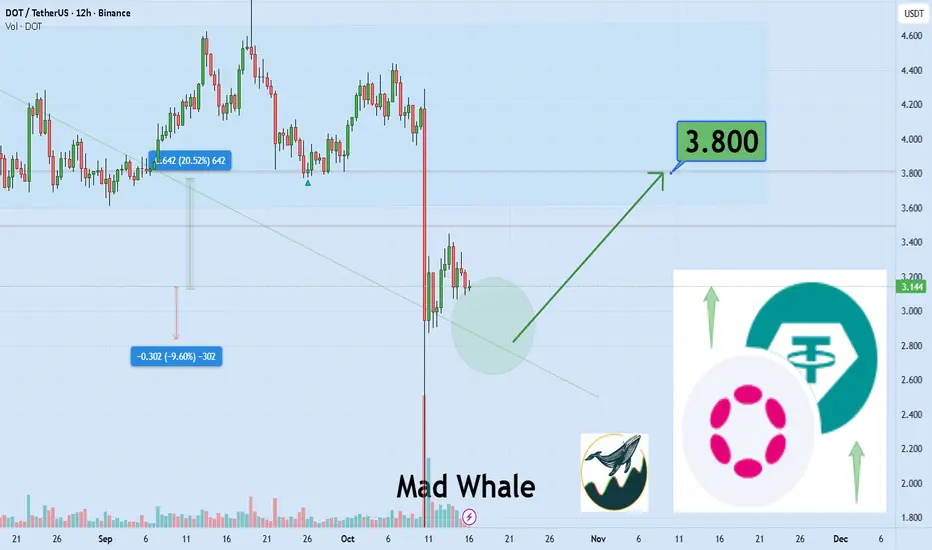
Dot can hit the upper targets if it holds the support areaHi the support and resistances on the chart are based on the previous data and weekly candlesticks if BINANCE:DOTUSDT holds this last support the potential of 20% gain is logical toward 3.80$
$DOTPolkadot’s architecture includes a central Relay Chain with non-native blockchains running on top of the network called Parachains. The Relay Chain handles the network’s security, consensus, and interoperability, secured using a Nominated Proof-of-Stake (NPoS) consensus model. Many parachains are written using the Polkadot Runtime Environment SDK, which allows developers to create their own parachains to operate on the Polkadot network.
There are many types of parachains each specialised for its own uses cases, such as:
System parachains, which uses Polkadot’s native token, DOT
Bridge parachains to connect to external network like Kusama, Polkadot’s Canary Network
Smart contract parachains for hosting EVM dApps.

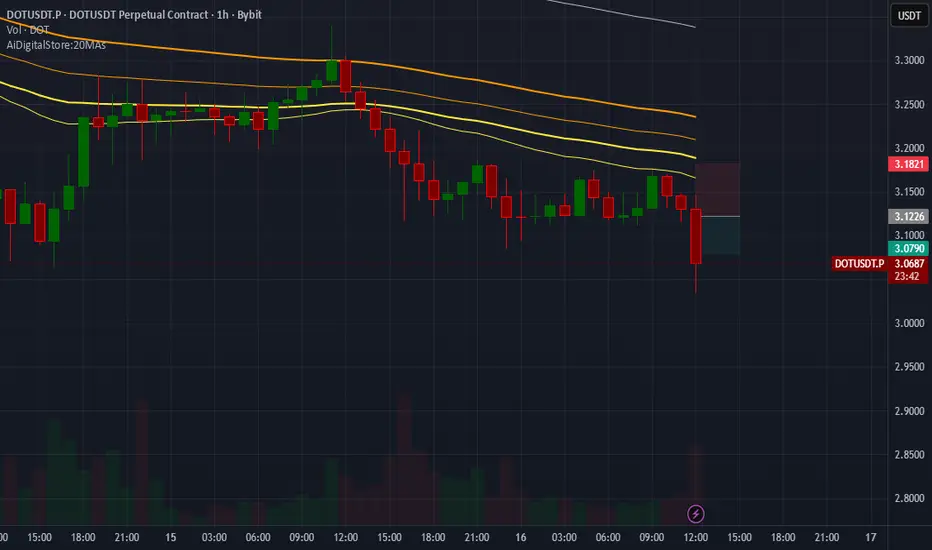
DOTUSDT.P SHORTDOTUSDT.P SHORT
The market has the potential for an downtrend
Price: 3.1226 $
Main target 3.0790 $
SL 3.1821 $
DOT MIGHT GO UPTRENDCan’t tell if the breakout will happen from here. Seems so..
3.6–3.8 was strong support, with a few false breakdowns.
Accumulation since February
1D MA50 above MA200 (Golden Cross "soon")
Dip Zone
Low Volatility

DOT: Still bullish and well-positioned for further gainsDOT: Still bullish and well-positioned for further gains
DOT continues to extend its upward move. The price reached 4.34 so far with minor moves.
Momentum looks weak considering BTC is testing strong territory again. However, considering all altcoins have plenty of room to grow further, the chances of a larger upward move still remain high.
It may take a short pause, but as long as it stays above 4.1, the chances of a bullish wave remain intact.
🎯 Key upside targets:
$4.43
$4.60
$4.85
You may find more details in the chart!
Thank you and Good Luck!

Can DOT/USDT Sustain Its Bullish Momentum This Week?🎯 DOT/USDT: The Kijun Breakout Heist 💎 | Swing/Day Trade Setup
📊 Market Overview: POLKADOT vs TETHER
The DOT/USDT pair is flashing some serious bullish signals, and this setup is looking too good to ignore! We've got a Kijun moving average breakout brewing alongside a CCI momentum oscillator golden cross — the kind of technical alignment that makes traders smile. 😏
🎯 The "Thief Strategy" Game Plan
Trading Style: Swing/Day Trade Hybrid
Bias: BULLISH 🚀
Confirmation: Kijun MA breakout + CCI golden cross momentum surge
💰 Entry Strategy: The Layered Limit Order Approach
Here's where it gets interesting. Instead of market buying like a rookie, we're using multiple limit orders (the "layering strategy") to scale into this position like professionals:
Suggested Entry Layers:
🎯 Layer 1: $4.150
🎯 Layer 2: $4.200
🎯 Layer 3: $4.250
You can add more layers based on your position size and risk appetite. The beauty of layering? You average into the move instead of gambling on one entry!
🛡️ Risk Management Zone
Stop Loss: $4.050 🚨
⚠️ IMPORTANT DISCLAIMER:
Dear Ladies & Gentlemen (Thief OG's) — this is MY stop loss level based on MY analysis. You are NOT obligated to use this level. Trading is YOUR responsibility, YOUR risk, YOUR reward. Set YOUR own stop loss based on YOUR risk tolerance. Manage your money, take your profits, and protect your capital at your own discretion.
🎯 Profit Target: Know When to Exit the Heist
Target Zone: $4.600 💰
This target aligns with:
Strong historical resistance
Overbought RSI/CCI conditions (potential trap zone)
Natural profit-taking area
🚨 Exit Strategy Reminder:
Dear Ladies & Gentlemen (Thief OG's) — this is MY target based on MY technical analysis. You are NOT required to follow this target. Take profits when YOU feel comfortable. Lock in gains, scale out, or let it ride — it's YOUR choice and YOUR capital. Make money, then take money at your own risk.
🔍 Key Technical Indicators Breakdown
✅ Kijun Moving Average: Bullish breakout confirmed
✅ CCI Momentum Oscillator: Golden cross formation (bullish momentum shift)
✅ Price Action: Higher lows forming, trend structure improving
✅ Volume Profile: Increasing buying pressure on breakout levels
💎 Related Pairs to Watch (Correlation Play)
Keep an eye on these correlated assets for confluence:
CRYPTOCAP:DOT Dominance — Overall Polkadot ecosystem strength
$KSM/USDT (Kusama) — Polkadot's canary network, often moves in tandem
$ATOM/USDT (Cosmos) — Similar interoperability narrative
$AVAX/USDT (Avalanche) — Competes in similar L1 smart contract space
$BTC/USDT — King Crypto correlation; DOT typically follows BTC trend direction
$ETH/USDT — Ethereum's strength often lifts altcoins including DOT
Why watch these? If CRYPTOCAP:DOT rallies while CRYPTOCAP:BTC and CRYPTOCAP:ETH consolidate, that's relative strength — a bullish divergence. If ASX:KSM pumps, CRYPTOCAP:DOT often follows. Smart traders watch the whole ecosystem, not just one chart! 👀
🧠 Final Thoughts: Trade Smart, Not Hard
This setup combines:
📈 Momentum confirmation (CCI golden cross)
📊 Trend confirmation (Kijun breakout)
💰 Smart entry execution (layered limits)
🛡️ Defined risk (clear stop loss)
🎯 Clear target (resistance + overbought zone)
The "Thief Strategy" isn't about greed — it's about stealing profits from the market with precision and discipline. Layer in, manage risk, and take profits when the market gives them to you. 💼
📌 Disclaimer
⚠️ This is the "Thief Style" trading strategy — for educational and entertainment purposes only. This analysis is NOT financial advice. Trading crypto carries substantial risk of loss. The "Thief" approach is a fun, stylish way to describe disciplined layered entries, but YOU are responsible for your own trading decisions, risk management, and capital. Trade what you can afford to lose. Do your own research (DYOR).
Not a registered financial advisor. Just a chart enthusiast sharing ideas. 🎨📊
✨ If you find value in my analysis, a 👍 and 🚀 boost is much appreciated — it helps me share more setups with the community!
#DOTUSDT #DOT #Polkadot #CryptoTrading #SwingTrading #DayTrading #TechnicalAnalysis #CCIOscillator #KijunBreakout #CryptoSignals #AltcoinSetup #LayeredEntry #RiskManagement #ThiefStrategy #BullishSetup #MomentumTrading

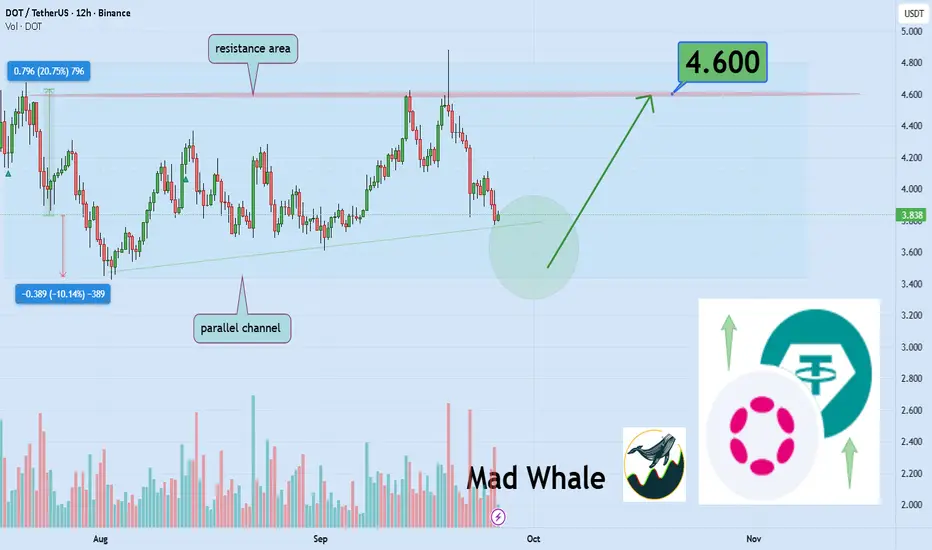
Polkadot testing strong support, potential 20% upside to 4.60Hello✌️
Let’s analyze Polkadot’s price action both technically and fundamentally 📈.
🔍Fundamental analysis:
Polkadot (DOT) is rolling out the JAM upgrade in Q4 2025, aiming for 1M TPS and stronger scalability for apps and enterprises.
With supply capped at 2.1B and inflation reduced, DOT could see stronger scarcity effects going forward.
📊Technical analysis:
BINANCE:DOTUSDT is trading near strong support within a parallel channel; if this zone holds, a 20% upside could push price toward $4.60 📈💹
📈Using My Analysis to Open Your Position:
You can use my fundamental and technical insights along with the chart. The red and green arrows on the left help you set entry, take-profit, and stop-loss levels, serving as clear signals for your trades.⚡️ Also, please review the TradingView disclaimer carefully.🛡
✨We put love into every post!
Your support inspires us 💛 Drop a comment we’d love to hear from you! Thanks, Mad Whale
DOT Follows BTC’s Bullish LeadDOT Follows BTC’s Bullish Lead
This week, Bitcoin staged a sharp recovery, flipping its outlook from mildly bearish to decisively bullish with a +9% surge in just three days.
That momentum has reignited optimism across all altcoins.
Polkadot (DOT) responded swiftly, completing a textbook Inverse Head and Shoulders pattern and rallying +9% since yesterday.
As shown in the chart, a short-term pullback toward $4.00 remains possible before the next leg higher.
🎯 Key upside targets:
$4.43
$4.60
$4.85
You may find more details in the chart!
Thank you and Good Luck!
❤️PS: Please support with a like or comment if you find this analysis useful for your trading day❤️

DOT///LONG///SWING TRADEDot looks like a textbook multi-year accumulation/consolidation phase. Great to start buying and hold. 20$ level may be a good target.

Dot short to $3.771Just opened this short position on DOT. Aiming for $3.771
monthly close today . Taking advantage of the increase volatility. Its favoring bears as trend is down
Sl: 3.933
Time sensitive

Polkadot (DOT): Wait For 200EMA To Be Broken And Get 200% ProfitDOT looks still bullish to us where on bigger timeframe we migth make 200% if we break that 200EMA and on smaller timeframes we are seeing 8-20% pump opportunity!
More in-depth info is in the video—enjoy!
Swallow Academy

PolkaDOT clearly shows BULLISH trend for OCTOBERPolkadot has an event this coming month.
The event proves to be fundamentally and technically potent for a cool bullish move.
I see this as an opportunity to milk the month of october.
See you at the TOP

Polkadot (DOT): Might Be Best Buy Entry, Might Be Not...Well, DOT is building up something here, where the price is at the local support zone, which has been holding the price pretty well.
SInce we touched that zone we have been also forming a smaller bullish trend which might result in an explosive movement towards the upper target zones (which would mean +50% of marketprice movement).
Swallow Academy

polkadot bullrun expected pricePolka Dot is holding it's support on weekly timeframe. First attempt to break local resistance is already happened. We are expected Dot ETF also which can drive it price at least 2x.

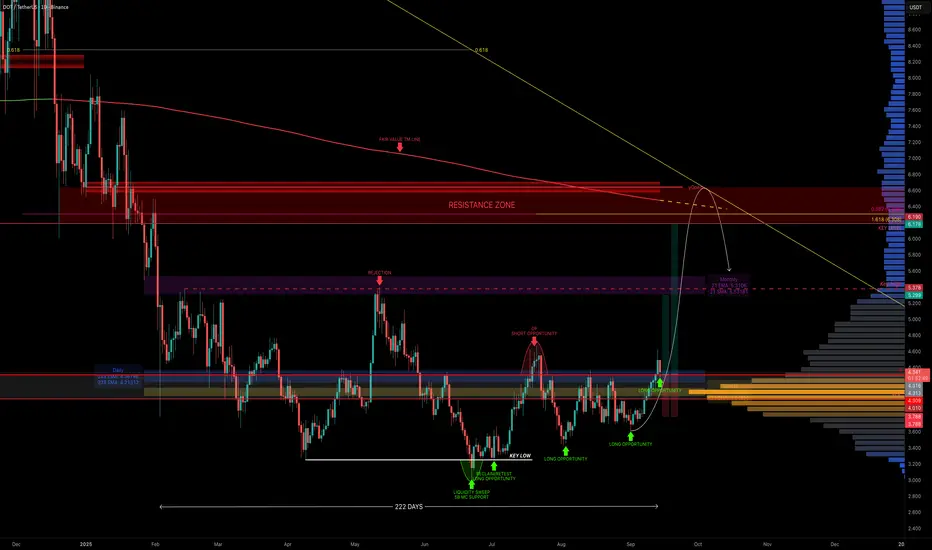
DOT — Key Levels Reclaimed, Breakout Ahead?DOT has been in sideways chop for 222 days, but things are finally getting interesting. Price is now sitting above the yearly level ($4.309), the daily 233 EMA/SMA, and the weekly 21 EMA/SMA. Even better, it reclaimed the POC of the entire 222-day range.
Why $4 Is So Important
Yearly level → $4.309
Daily 233 EMA → $4.37 / Daily 233 SMA → $4.21
Weekly 21 EMA → $4.15 / Weekly 21 SMA → $4.05
POC of 222-day range → $4
0.618 Fib retracement (current move) → $4
That’s a whole lot of support stacked at one zone.
Where It Gets Exciting (Targets)
First major target is the monthly 21 EMA/SMA ($5.3–$5.5), which also lines up with the range highs. That’s the first real test. The swing target zone sits around $6–$6.5, with multiple layers of confluence:
Key Level → ~$6
Fair Value Trend Model Line → ~$6.5
0.382 Fib retracement of the downtrend → ~$6.19
0.618 Fib speed fan → ~$6.2 (October projection)
1.618 trend-based Fib extension → $6.308
Market Cap Confluence: 10B market cap at $6.18
Yearly Open: $6.642 → the overall target and an additional layer of resistance
📌 This creates a solid resistance cluster between $6–$6.6, ideal for taking profits and potentially looking for shorts.
🟢 Long Trade Idea
Entry: Ladder longs from $4.36 down to $4
Stop: Below $4 (clear invalidation)
Take Profit: If $4 holds, DOT’s path is clear: first stop $5.3-$5.5, then $6.0–$6.6 as the macro target with the yearly open at $6.642 marking the final resistance.
Key Levels
Support → $4.36–$4
Resistance → $5.3–$5.5, then $6.2–$6.6 (10B market cap $6.18 + yearly open $6.642)
🔍 Indicators used
LuxAlgo — Liquidity Sentiment Profile (Auto-Anchored)
DriftLine — Pivot Open Zones → For identifying key yearly/monthly/weekly/daily opens that act as major S/R reference points
Multi Timeframe 8x MA Support Resistance Zones → to identify support and resistance zones such as the monthly 21 EMA/SMA.
Fair Value Trend Model → Calculates a regression-based fair value curve
➡️ Available for free. You can find it on my profile under “Scripts” and apply it directly to your charts for extra confluence when planning your trades.
_________________________________
💬 If you found this helpful, drop a like and comment!
Bottom candle for DOTBearish breaker controlling the price, down, 3rd algo target hit 1.618 fib.
Waiting for it to go around 10.913, Wbb- by 50%.

DOT analysisI think nice price to wait in that box(?)
because
The Polkadot DAO has signaled support for a hard cap, by passing Referendum 1710 on the “Wish For Change” track, with 81% in favor.

Polkadot Range-Bound Between Weekly Levels, POC Acts as MagnetPolkadot continues to trade between weekly support at $3.39 and resistance at $4.40. Price action remains rotational within this range, with the point of control acting as the primary magnet.
Polkadot’s price has been consolidating for an extended period within a defined weekly range. After multiple rotations between the value area low (VAL) and value area high (VAH), the market remains indecisive. Currently, price is gravitating toward the point of control (POC), a key level that often dictates the next directional bias.
Key Technical Points:
- Support: Weekly level at $3.39 holding as range low.
- Resistance: Weekly level at $4.40 capping range high.
- Structure: Rotational movement between value area levels with POC pull.
The persistence of range-bound trading highlights the ongoing battle between buyers and sellers. Each rotation between the $3.39 support and $4.40 resistance reflects uncertainty, but also opportunity for traders who capitalize on mean-reversion setups.
The POC currently acts as a magnet, pulling price into balance. This level’s significance cannot be understated, as acceptance above or below it could shape the next phase of price development. Should Polkadot establish bullish acceptance above the POC, a rotation toward $5 becomes increasingly likely. Conversely, rejection at the POC could result in another retest of range lows.
From a market structure perspective, the extended consolidation may ultimately lead to a breakout, but until that occurs, traders should continue treating the price action as rotational.
What to Expect in the Coming Price Action:
Polkadot remains locked within its established range. A decisive break from the POC will provide clearer directional cues, with upside potential toward $5 if buyers can seize control.

DOTUSDT - 200% Upside - Long SetupDOTUSDT has been in a long consolidation. A bullish divergence was there and now a wedge pattern was in play and finally a bullish breakout and retest could be observed. This would mean a trend reversal and further Higher Highs and Higher Lows. Therefore, giving the perfect opportunity for a long entry for a 3x (200%) return.
Fundamentally the new tokenomics and immense focus on interoperability makes it more promising that PolkaDot could be seen flying in a matter of no time.
So going long on PolkaDOT.

Dot/Usdt
Polkadot cryptocurrency is worth buying at the price of $3.80, with a stop-loss at $3.40 and a target price of $4.80. It could potentially experience around 30% price growth from now.

DOT / USDT : Momentum building for a strong rallyDOT/USDT is showing strong momentum and looks ready for a rally. If momentum continues to build, the next upside targets are $5 – $6.
Always manage risk and wait for confirmation before entering.
