DOT: Still bullish and well-positioned for further gainsDOT: Still bullish and well-positioned for further gains
DOT continues to extend its upward move. The price reached 4.34 so far with minor moves.
Momentum looks weak considering BTC is testing strong territory again. However, considering all altcoins have plenty of room to grow further, the chance
Related pairs

Can DOT/USDT Sustain Its Bullish Momentum This Week?🎯 DOT/USDT: The Kijun Breakout Heist 💎 | Swing/Day Trade Setup
📊 Market Overview: POLKADOT vs TETHER
The DOT/USDT pair is flashing some serious bullish signals, and this setup is looking too good to ignore! We've got a Kijun moving average breakout brewing alongside a CCI momentum oscillator golden

DOT MIGHT GO UPTRENDCan’t tell if the breakout will happen from here. Seems so..
3.6–3.8 was strong support, with a few false breakdowns.
Accumulation since February
1D MA50 above MA200 (Golden Cross "soon")
Dip Zone
Low Volatility

$DOT WEEKLY CHART UPDATE #DOT is showing a strong long-term CRYPTOCAP:DOT WEEKLY CHART UPDATE
CRYPTOCAP:DOT is showing a strong long-term accumulation pattern around the $3-4 zone. This level has acted as a solid historical support since 2022. If it holds, we could see a major reversal ahead with potential upside targets around $10–$20 by 2026.
The stru

$DOTPolkadot’s architecture includes a central Relay Chain with non-native blockchains running on top of the network called Parachains. The Relay Chain handles the network’s security, consensus, and interoperability, secured using a Nominated Proof-of-Stake (NPoS) consensus model. Many parachains are wr

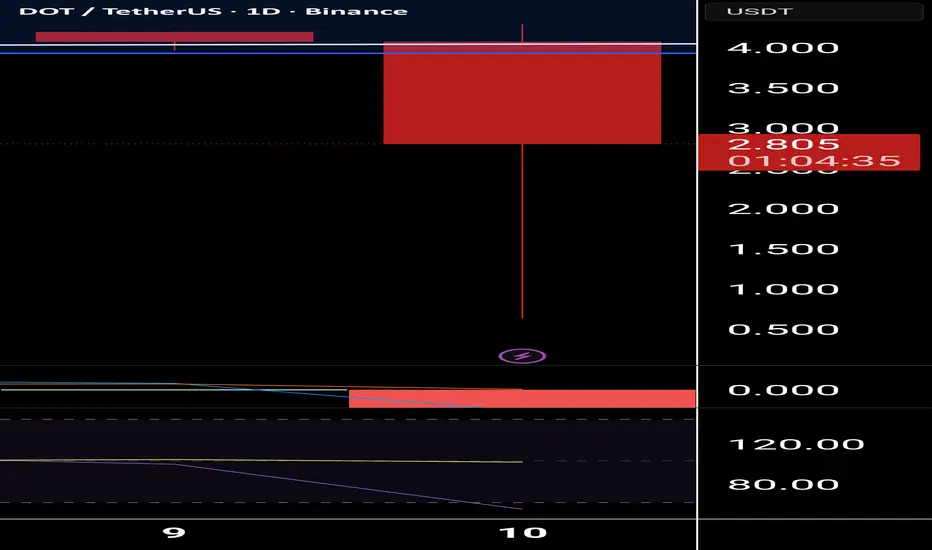
Dot What just happened? Does anyone know what just happened?
Also could either be the start of the Bull run for this coin or its demise? Be safe guys, I just lost a lot on this one, At the moment.
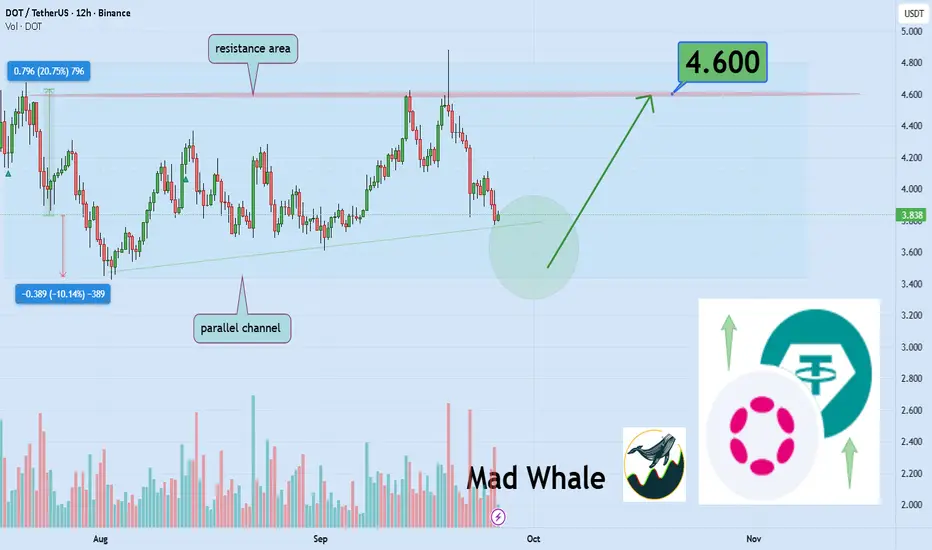
Polkadot testing strong support, potential 20% upside to 4.60Hello✌️
Let’s analyze Polkadot’s price action both technically and fundamentally 📈.
🔍Fundamental analysis:
Polkadot (DOT) is rolling out the JAM upgrade in Q4 2025, aiming for 1M TPS and stronger scalability for apps and enterprises.
With supply capped at 2.1B and inflation reduced, DOT coul
DOT Follows BTC’s Bullish LeadDOT Follows BTC’s Bullish Lead
This week, Bitcoin staged a sharp recovery, flipping its outlook from mildly bearish to decisively bullish with a +9% surge in just three days.
That momentum has reignited optimism across all altcoins.
Polkadot (DOT) responded swiftly, completing a textbook Invers

DOT///LONG///SWING TRADEDot looks like a textbook multi-year accumulation/consolidation phase. Great to start buying and hold. 20$ level may be a good target.

Polkadot (DOT): Wait For 200EMA To Be Broken And Get 200% ProfitDOT looks still bullish to us where on bigger timeframe we migth make 200% if we break that 200EMA and on smaller timeframes we are seeing 8-20% pump opportunity!
More in-depth info is in the video—enjoy!
Swallow Academy

See all ideas
Summarizing what the indicators are suggesting.
Oscillators
Neutral
SellBuy
Strong sellStrong buy
Strong sellSellNeutralBuyStrong buy
Oscillators
Neutral
SellBuy
Strong sellStrong buy
Strong sellSellNeutralBuyStrong buy
Summary
Neutral
SellBuy
Strong sellStrong buy
Strong sellSellNeutralBuyStrong buy
Summary
Neutral
SellBuy
Strong sellStrong buy
Strong sellSellNeutralBuyStrong buy
Summary
Neutral
SellBuy
Strong sellStrong buy
Strong sellSellNeutralBuyStrong buy
Moving Averages
Neutral
SellBuy
Strong sellStrong buy
Strong sellSellNeutralBuyStrong buy
Moving Averages
Neutral
SellBuy
Strong sellStrong buy
Strong sellSellNeutralBuyStrong buy
Displays a symbol's price movements over previous years to identify recurring trends.
Frequently Asked Questions
The current price of DOT / UST (DOT) is 3.04770000 USDT — it has risen 5.86% in the past 24 hours. Try placing this info into the context by checking out what coins are also gaining and losing at the moment and seeing DOT price chart.
DOT / UST price has fallen by −28.30% over the last week, its month performance shows a −26.60% decrease, and as for the last year, DOT / UST has decreased by −25.18%. See more dynamics on DOT price chart.
Keep track of coins' changes with our Crypto Coins Heatmap.
Keep track of coins' changes with our Crypto Coins Heatmap.
DOT / UST (DOT) reached its highest price on Aug 18, 2020 — it amounted to 349.00000000 USDT. Find more insights on the DOT price chart.
See the list of crypto gainers and choose what best fits your strategy.
See the list of crypto gainers and choose what best fits your strategy.
DOT / UST (DOT) reached the lowest price of 2.63220000 USDT on Aug 22, 2020. View more DOT / UST dynamics on the price chart.
See the list of crypto losers to find unexpected opportunities.
See the list of crypto losers to find unexpected opportunities.
The safest choice when buying DOT is to go to a well-known crypto exchange. Some of the popular names are Binance, Coinbase, Kraken. But you'll have to find a reliable broker and create an account first. You can trade DOT right from TradingView charts — just choose a broker and connect to your account.
Crypto markets are famous for their volatility, so one should study all the available stats before adding crypto assets to their portfolio. Very often it's technical analysis that comes in handy. We prepared technical ratings for DOT / UST (DOT): today its technical analysis shows the strong sell signal, and according to the 1 week rating DOT shows the strong sell signal. And you'd better dig deeper and study 1 month rating too — it's sell. Find inspiration in DOT / UST trading ideas and keep track of what's moving crypto markets with our crypto news feed.
DOT / UST (DOT) is just as reliable as any other crypto asset — this corner of the world market is highly volatile. Today, for instance, DOT / UST is estimated as 15.43% volatile. The only thing it means is that you must prepare and examine all available information before making a decision. And if you're not sure about DOT / UST, you can find more inspiration in our curated watchlists.
You can discuss DOT / UST (DOT) with other users in our public chats, Minds or in the comments to Ideas.