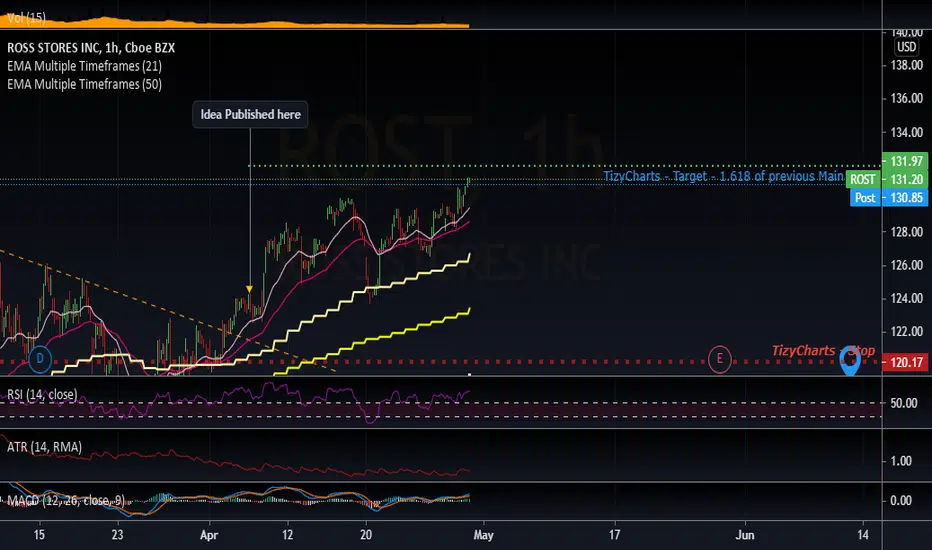
Target hit !ROST just hit its first target. EMA 50 hourly still working really nice as support for the fast uptrend.
RSO trade ideas


Long $ROST Pennant Breakout www.Classic-Options(dot)netTrading Idea: Long $ROST Pennant Breakout www.Classic-Options.net

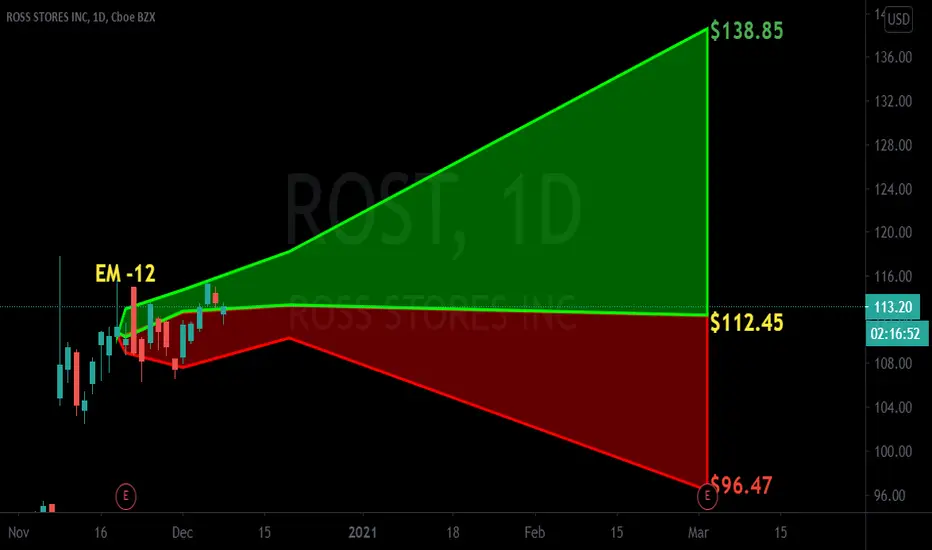
$ROST with a neutral outlook following its earning release $ROST posted its earnings with a positive over reaction following its release with the PEAD projecting a neutral outlook for the stock placing it in Drift B
If you would like to see the Drift for another stock please message us. Also click on the Like Button if this was useful and follow us or join us.
Ross short if we break this levelRsi has falling potential, has bearish divergence, and macd has bearish cross

ROSS STORES Strategy DailyHey guys, ROSS STORES is in a fake bearish configuration with low volume of sales made and we can see significant buyer rejection. On the TIMEFRAME 1Min the buyers are breaking the VWAP, it may have power on this price increase attempt. Great potential to join the next high See the TIMEFRAME 4H, then close the bearish gap thereafter to go to the next high.
Please LIKE & FOLLOW, thank you!

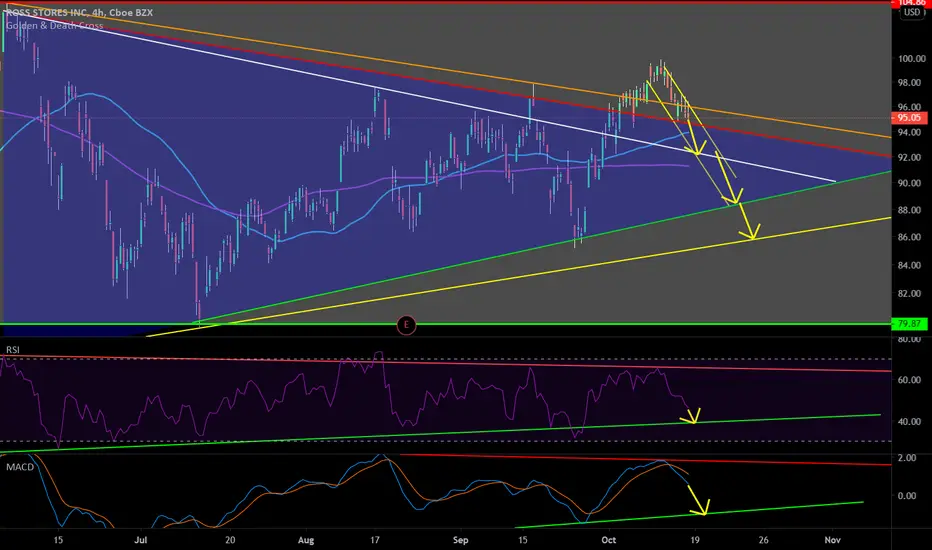
Ross ShortAnother very nice Daily Head and Shoulders pattern in an overall bearish trend. Could be a great short if breaks the H&S neckline soon. Will be watching for a breach of the H&S neckline in yellow.

ROST Long Swing Trade for Week of 7.19ROST looking like a buy here this week(19.7.2020). 4hr chart has already had a MACD cross over, with volume; along with Fridays action
closing with bullish volume. I would expect this to continue over the coming days if Monday has the same action. With earnings
at the latter half of next month; no reason to expect any bad news comes out.
Would want 1hr candle close above 85.50 to enter this trade.
Targets/ Stops:
Target 1: 88.22
Target 2: 92.00
Target 3: 98.61
Stop: 81.60.
Best of Luck,
--d0x


Monday Watchlist This Ascending Triangle breakout occurred simultaneously with a 200 sma crossover. Buy on continued volume for a possible position swing-trade.

Saham syarikat ROSTROST adalah kod bagi syarikat Ross Stores Inc yang diperbuat dari segi sektor pengguna. Mengikut pemerhatian gelombang sahlun tentang saham ini adalah downtrend@bearish dengan penurunan sebanyak 19.62% dalam tempoh 3 bulan lepas. Dari segi Syariah, saham ini adalah Patuh Syariah

$ROST can continue to be falling todayCorrelation trading strategy idea analysis.
2 days ago I showed you the possibility to make a long trade of Ross Stores after publishing the earnings report.
But the earnings report was worse than I expected.
Yesterday $ROST fell lover. Also, there was a good correlation between this stock and $SPY.
In my previous ideas, I showed my vision of correlating moves.
There are a lot of companies, which reflects the overall market condition and are good for correlation intraday trading.
But after the good news, some companies more tend to go up with the market than do down.
After the bad news, like in the case with $ROST, companies tend to go down with the market than go up.
Today I want to show you the possibility to make one of more intraday correlation shorts of this stock.
Look on the $SPY and $ROST charts.
The last two days downside $ROST moves were stronger than upside moves.
Following the correlation trading strategy, it is reasonable to wait for correlated support level breaking.
When $SPY and $ROST simultaneously break their support levels, It will be possible to short $ROST.
Do not view this idea as a recommendation for trading or investing. It is published only to introduce my own vision.
Always do your own analysis before making deals. When you use any materials, do not rely on blind trust.
You should remember that isolated deals do not give systematic profit, so trade/invest using a developed strategy.
If you like my content, you can subscribe to the news and receive my fresh ideas.
Thanks for being with me!

ROSS The Recession Called, it wants to talk about the .0618 I feel that the recession is obviously here. And if that were to be the case the tweezer top on the monthly for Ross really makes it bad for this stock. MACD crossing down on the monthly.

$ROST can gap up todayEarnings trading strategy signal.
The US off-price retail apparel and home fashion stores operator Ross Stores has been increasing sales (from $11.04 bln in 2015 to $14.98 in 2019) and EPS (earnings per share: from 2.24 to 4.3) for 4 years straight.
The last two of four published $ROST ratings from analyst companies were good, one was neutral.
So the price is more predetermined to rise than fall.
The Zacks Consensus Estimate for EPS is $1.26, (+5% year-over-year change), for revenue — $4.37 billion (+6.4% from the year-ago quarter) — finance.yahoo.com
Previous earnings report beats EPS and revenue estimates.
I suppose this earnings report will also be with such a pleasant surprise.
Also, confident EPS and sales growth are positive factors, which can cause today`s gap up.
So we hypothesize that $ROST is ready for the next gap up after publishing earnings report today after market close.
The last three days show the bearish market probably ends.
So we can long stocks before earnings again.
Due to strategy, the buy long can be from the price 10 minutes before market close.
It is too risky to buy now due to huge ATR.
target profit — +$5 per share;
stop-loss — -$5 per share.
Risk/reward is 1:1, but correct strategy implementation implies more than 60% of profit trades.
Do not view this idea as a recommendation for trading or investing. It is published only to introduce my own vision.
Always do your own analysis before making deals. When you use any materials, do not rely on blind trust.
You should remember that isolated deals do not give systematic profit, so trade/invest using a developed strategy.
If you like my content, you can subscribe to the news and receive my fresh ideas.
Thanks for being with me!


ROSS near short term top? Pull back to $100. Ross has a top forming monthly. Macd crossing on weekly as well as rsi maybe topping. This is not trading advice.

Ross Stores valued fair to rich$ROST shows a tremendously steady upward trend over the last 6 years.
Currently trading more to the upper end of the trend channel.
Also my dividend-radar shows that there is no "value" to be had here.
Currently for me only a hold and if it moves to the 120-126 area within the next 3 months I will shed some of my position.
In the opposite direction it will be more interesting to accumulate if the price range between $90 to $80 is hit. This would imply a drop of roughly 30%

Ross stores on verge of breakout about $113BREAKOUT ENTRY LEVEL $113
STOP LOSS $110
PRICE TARGET $123
Average analysts price target $110
Average analysts recommendation OVERWEIGHT
Short interest 1.3%
P/E ratio 24
Company profile
Ross Stores, Inc. engages in the operation of off-price retail apparel and home accessories stores. Its products include branded and designer apparel, accessories, footwear, and home fashions through the Dress for Less and dd's DISCOUNTS brands. The company was founded by Stuart G. Moldaw in 1957 and is headquartered in Dublin, CA.


ROST t.a. & set upROST price is showing signs of an overall uptrend pattern long term, consistently making higher highs and higher lows. Price also trades above the SMA200, indicating potential bullish movement.
Price seems to react best with EMA/SMA levels on the 4 hr chart. Price just broke above EMA10, and SMA100 today, also the last candle stick formed a Long Bullish Candle, as well as extremely oversold RSI levels @30. Strong convergence of combined signals now indicating bullish momentum likely to continue.
A good swing trade entry might be: only if price breaks above AND closes above both the EMA10 and SMA50 (4 hour chart) around or above 107.84 level by end of day close
A stop could be set: 106.74 @ -1%
Exit could be: 110 area @ +3%
Risk/Reward ratio favorable @ 3:1

Classic V PatternThis looks the same on an intraday chart as it does on a daily with a target of about $6.70 per share.
