dYdX Founder Steps Down as CEO of the Decentralized ExchangeAntonio Juliano, the founder of dYdX Trading Inc., has stepped down as CEO of the decentralized derivatives exchange. The change was not sudden to the internal team, employees, or stakeholders, but had been in discussion. Juliano stated that the SEC has not taken action against dYdX Trading and that
dYdX shortHello, this is my short idea for dYdX.
Short target 2,7 usd.
Price maybe drop to 0,50 usd, long, summer. Long ATH 6 usd and 12 usd.
dYdX is the leading DeFi protocol developer for advanced trading. Trade 67 cryptocurrencies with low fees, deep liquidity, and up to 20× Buying Power.
Circulating sup

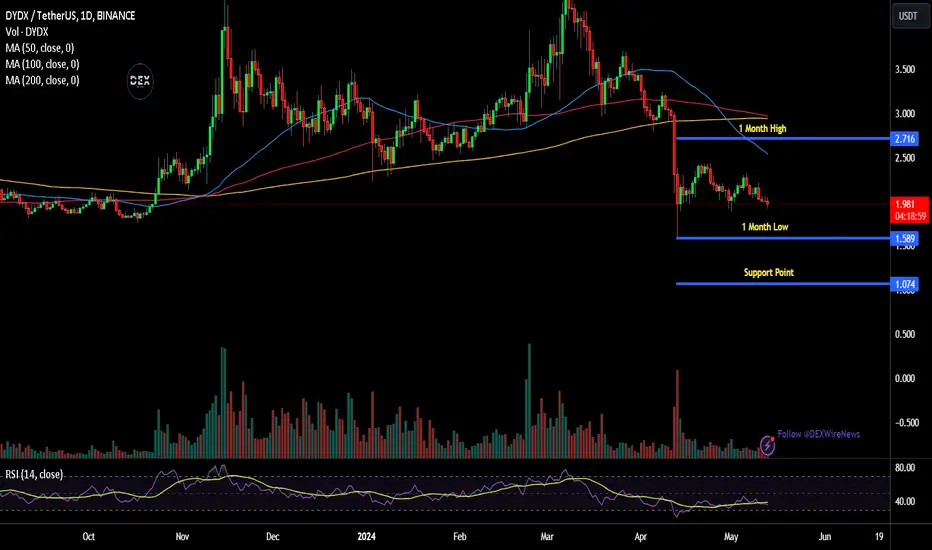
DYDX Gaining Momentum to Leave Descending Channel? 👀🚀 💎Paradisers, #DYDX is navigating a descending channel, poised for a potential breakout.
💎When it breaks from the channel, we'll observe a retest to confirm the move before executing our strategies. This retest is vital as it verifies the bullish momentum. If #dYdX secures the support at $1.85 and a

DYDX LongWe are waiting for a breakout on the 4h timeframe from this wedge on DYDX. A few alts are showing this behaviour and we'll look closely at their pa if they make a lower local low, it could be the perfect entry.
Regardless, we are looking to swing trade DYDX to the 2.7$ level minimum. The closer w

📈Strategic Insights on DYDX Movements🔔🔍Yesterday, Bitcoin was rejected at the 63,200 resistance level and remains within its trading box, potentially heading towards the bottom. As Bitcoin dominance continues to rise, altcoins have suffered more, with many breaking through their support levels and continuing to decline. One such altcoin

DYDX buy setupWaves C and D that you see on the chart are related to a large diametric pattern
DYDX appears to be at the bottom of wave D and is making a reversal pivot
By maintaining the green range, it can move towards the targets
The least risky range for entering buy/long positions is the optimized range

DYDX - Lost Case? Time to JUMP SHIP?👎🤔DYDX-USDT🤔
We've lost a key neckline support and until we can close ABOVE this zone again, I'd say the price is still bearish for the short term:
Against BTC, I'm a little worried - no sign of strength here as the price stayed behind with the recent BTC ATH:
To be honest, if the price drops lo

DYDXUSDT.P (Short, 5X) DYDXUSDT.P (Short, 5X)
Entry:
1) 2.104
2) 2.199
Take-Profit Targets:
1- 2.067 (20% of profit)
2- 2.022 (30% of profit)
3- 1.975 (41% of profit)
4- 1.928 (52% of profit)
5- 1.865 (67%of profit)
Stop-Loss:
2.226

$$$DYDXUSDT, GOING UP FOLLOWED BY A ASCENDING CHANNEL$$$Welcome, Trader. Welcome to our crypto community! 🚀We are delighted to welcome you, whether you are an experienced trader or new to cryptocurrency.
We are willing to discuss #DYDXUSDT💹.
#DYDXUSDT 🔥🚀
___________
Update:
Time Frame: Weekly
➡️DYDXUSDT moving up followed by the channel, Resting on

$DYDX-Ascending Channel Formation Dear Traders,
We are convening a discussion focused on #DYDXUSDT
The Assending Channel Pattern is Formed
Also its on a Support and It will bounce back
In Case of Successful Breakout, Expecting a Bullish Move of 210% 🚀
Regards: AnnaTradeCharts
#Bitcoin #Crypto #Ethereum #Cryptocurrency #CryptoTra

See all ideas
Curated watchlists where DYDXUSDT.P is featured.
