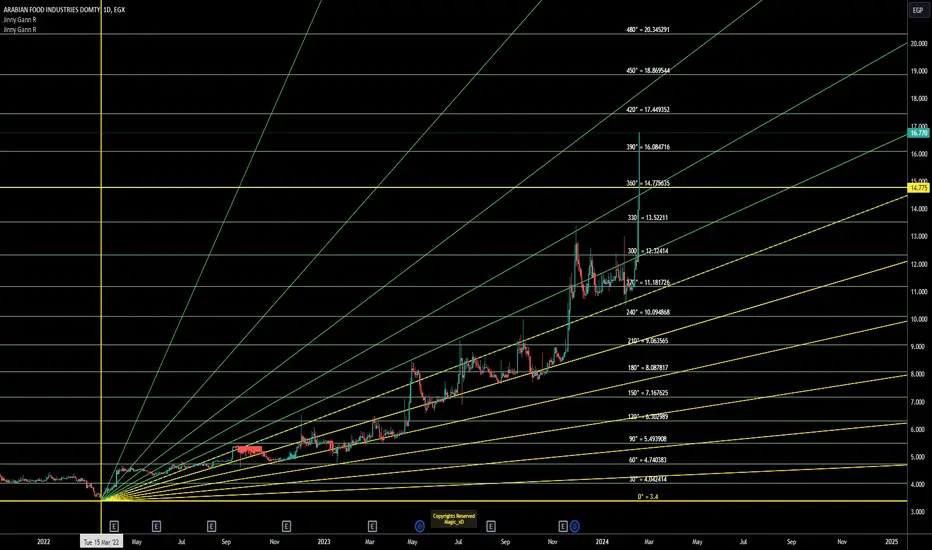
DOMT – Hourly Time Frame
DOMT is showing a compelling bullish setup after reacting positively from a rising trendline support. Price respected the ascending structure and rebounded with strength, signaling that buyers continue to defend higher levels.
The breakout gap triggered by positive financial news adds significant
Arabian Food Industries Co.
No trades
No trades
Compare with Arabian Food Industries Co.
130.91 M EGP
9.39 B EGP
159.33 M
Next report date
—
Report period
—
EPS estimate
—
Revenue estimate
—
Company info
Sector
Industry
CEO
Mohammad Omar Mohammad El-Domaty
Website
Headquarters
Giza
Founded
1984
IPO date
Mar 22, 2016
ISIN
EGS30031C016
FIGI
BBG00BDZ9V32
Identifiers
ISIN EGS30031C016
Arabian Food Industries Co. manufactures food and dairy products. Its products include cheese, juice, bakery, creamy, and dairy. The company was founded by Omar Mohammed Abdel Hameed El-Domaty on March 14, 1984 and is headquartered in Giza, Egypt.
DOMT: Short-Term Setup Builds Post-Correction Momentum 📊 DOMT: Short-Term Setup Builds Post-Correction Momentum 🚀📈
🔍 The Pulse:
Arabian Food Industries (Domty) is medium-term bullish and building short-term strength. 🔄
After a 200MA test, the price broke its downtrend line but failed to sustain a breach above 26.00 EGP resistance. 📉
🧱 The Key Struct
OMT: Multi-Week Resistance Rejection Triggers 24.75 Breakout📊 DOMT: Multi-Week Resistance Rejection Triggers 24.75 Breakout ⚠️📉
🔍 The Pulse:
After relentlessly testing the formidable 26.00 EGP resistance wall for two full weeks, DOMT has officially capitulated into a correction phase. 📉⏳
Crucially, the bears have sliced through the critical 24.75 EGP supp
DOMT: Margin Pressure & Debt WeightDOMT: Margin Pressure & Debt Weight 🧀📉
The Marketing War: A 46% spike in marketing costs is a double-edged sword.
It shows Domty is desperately defending its territory against OLFI and JUFO, but it’s a "race to the bottom" that is cannibalizing their profit margins. 💸⚔️
The Cash Crunch: This is t
DOMT is currently in a correction phase after a strong uptrend cDOMT is currently in a correction phase after a strong uptrend channel 📈.
The price is still trading above the 200 MA, and today it touched it and rebounded quickly, which is a constructive signal.
For clearer positivity, I would wait for:
🔹 A break of the triangle pattern 📐
🔹 A move above the Fib
DOMT had a upward wave, then consolidated abov the Fib 38.2% lvlDOMT had a strong upward wave 📈, then consolidated above the Fib 38.2% level.
Yesterday’s move looked like a fake breakout ⚠️.
I’ll consider a shift back to positivity only if the stock breaks and closes above the main consolidation resistance at 25.82 ✔️🔥.
👍 If you like my posts, please conside
DOMT Technical ViewDOMT Technical View 📊
Short term: sideways consolidation
Mid term: still in an uptrend
Key support / invalidation: 24.8
If price dips below support, 23.8 becomes an interesting level to watch
Breakout trigger: strong volume above 25.9
🎯 Targets: 27 (recent ATH) and 28 if momentum continues
DOMT "Billionaire revenues and profits that are a joke Q1 financials. Revenue is up 2.1 billion Egyptian pounds, but profits are down compared to the last 10 quarters. The company blames flat product prices while raw material costs are skyrocketing. Seriously, what's the deal? Are they just waiting for us to tell them to raise prices or cut costs? If t
DOMT Betweenincrease "EPS" and increase in volumeOn a specialized economic level, after reviewing the financial statements for the first quarter of the stock, the increase in the number of shares was marginal (in the millions) and the increase in earnings per share was also by a fraction of a penny. However, on a technical analysis level of the vo
See all ideas
Summarizing what the indicators are suggesting.
Oscillators
Neutral
Oscillators
Neutral
Summary
Neutral
Summary
Neutral
Summary
Neutral
Moving Averages
Neutral
Moving Averages
Neutral
Displays a symbol's price movements over previous years to identify recurring trends.
Frequently asked questions
The current price of DOMT is 24.50 EGP — it has decreased by −2.47% in the past 24 hours. Watch Arabian Food Industries Co. stock price performance more closely on the chart.
Depending on the exchange, the stock ticker may vary. For instance, on EGX exchange Arabian Food Industries Co. stocks are traded under the ticker DOMT.
DOMT stock has fallen by −0.08% compared to the previous week, the month change is a −11.42% fall, over the last year Arabian Food Industries Co. has showed a 14.86% increase.
DOMT reached its all-time high on Dec 26, 2001 with the price of 100.00 EGP, and its all-time low was 3.40 EGP and was reached on Mar 15, 2022. View more price dynamics on DOMT chart.
See other stocks reaching their highest and lowest prices.
DOMT stock is 3.31% volatile and has beta coefficient of 0.36. Track Arabian Food Industries Co. stock price on the chart and check out the list of the most volatile stocks — is Arabian Food Industries Co. there?
Today Arabian Food Industries Co. has the market capitalization of 7.04 B, it has decreased by −7.52% over the last week.
Yes, you can track Arabian Food Industries Co. financials in yearly and quarterly reports right on TradingView.
Arabian Food Industries Co. is going to release the next earnings report on Oct 13, 2026. Keep track of upcoming events with our Earnings Calendar.
Yes, DOMT dividends are paid annually. The last dividend per share was 0.85 EGP. As of today, Dividend Yield (TTM)% is 3.41%. Tracking Arabian Food Industries Co. dividends might help you take more informed decisions.
Arabian Food Industries Co. dividend yield was 0.00% in 2025, and payout ratio reached 0.00%. The year before the numbers were 3.09% and 59.95% correspondingly. See high-dividend stocks and find more opportunities for your portfolio.
Like other stocks, DOMT shares are traded on stock exchanges, e.g. Nasdaq, Nyse, Euronext, and the easiest way to buy them is through an online stock broker. To do this, you need to open an account and follow a broker's procedures, then start trading. You can trade Arabian Food Industries Co. stock right from TradingView charts — choose your broker and connect to your account.
Investing in stocks requires a comprehensive research: you should carefully study all the available data, e.g. company's financials, related news, and its technical analysis. So Arabian Food Industries Co. technincal analysis shows the strong sell today, and its 1 week rating is sell. Since market conditions are prone to changes, it's worth looking a bit further into the future — according to the 1 month rating Arabian Food Industries Co. stock shows the buy signal. See more of Arabian Food Industries Co. technicals for a more comprehensive analysis.