ETHUSD Weekly
Great weekly pullback for ETHUSD. Long-term buy here with the market structure bill coming next month.
Trade ideas

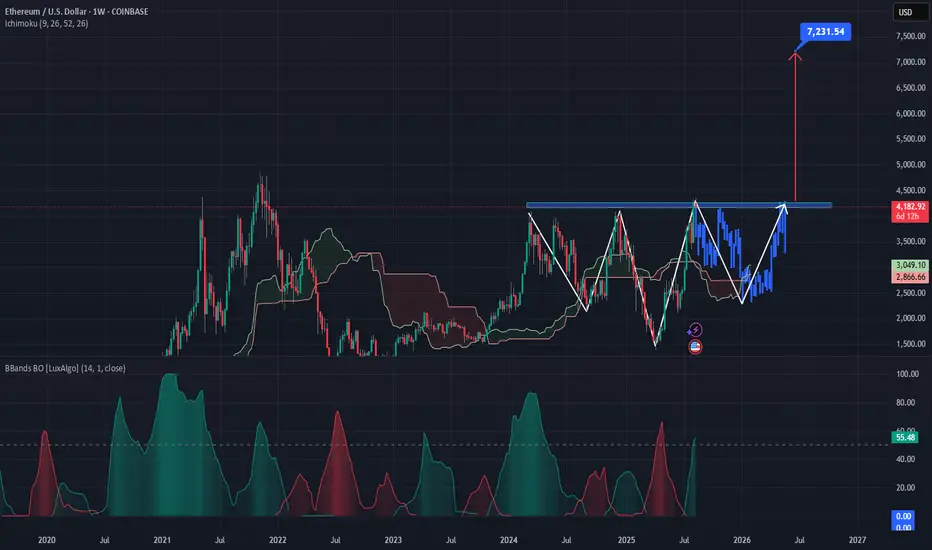
ETH possible reverse HNS pattern predictionAs ETH is trading around psychological zone of 4,000 which it has tested many times. I am seeing some inducement in this area and a potential to reach 7,200 after making reverse HNS pattern. Let's see how it plays out
ETH Long - 64% increase from $2700 Price RegionThis call is based on a volatility expansion 50% level retest on the 3d. This tool identifies volatility expansion events, tracks how price behaves after them, and builds volatility based projection levels and statistics. It shows how far reversal moves typically travel and how reliable they have been.
I expect a re-test of these same levels provided on the 4h time frame as indicated by the red and white boxes on the upper bound of price.
We have had a good couple weeks of buyers and sellers trading around this level with out any further violent moves below it.
Bitcoin is also starting to show positive market structure on LTF's. I believe during the BTC dead cat bounce alt season will have finally arrived after 4-5 years

ETH Bull Run Alert: From $1,780 Lows to $6,100 Peaks? My TradingHey traders and crypto fam! If you're grinding TradingView charts like me, you've probably eyed Ethereum's wild ride. Right now, ETH is hovering around $2,700 (as of Nov 22, 2025), but let's talk that dip you're mentioning—back to $1,780? That sounds like a throwback to those brutal 2022 lows or a potential retest if macro headwinds (think Fed hikes or BTC dominance spikes) hit hard. But here's the bullish thesis that's got me stacking: In this bull cycle, ETH ain't just recovering—it's primed to moon to $6,100+ by mid-2026. Why? Ethereum's ecosystem is firing on all cylinders: ETF inflows are pouring in, Layer-2 scaling (thanks to Dencun and Prague upgrades) is slashing fees, and DeFi TVL is exploding past $200B. Plus, restaking protocols like EigenLayer are locking up supply like never before. If BTC hits $150K
Risks? Yeah, crypto's volatile AF. If BTC dumps below $80K or regs tighten (SEC eyeing staking?), we could wick back to $1,780. But with 42% of experts saying "buy now" and ETF flows at record highs, the risk/reward screams LONG ETH. What do you think—$6,100 too conservative, or am I dreaming? Drop your takes below, smash that follow button for daily updates, and let's turn this prediction into profits. To the moon! #ETH #CryptoBull #TradingView

Weekly ETH possible fair value locatedIt is possible we going to have a up week. We may entering a bit longer down movement but there are always a relief rally.


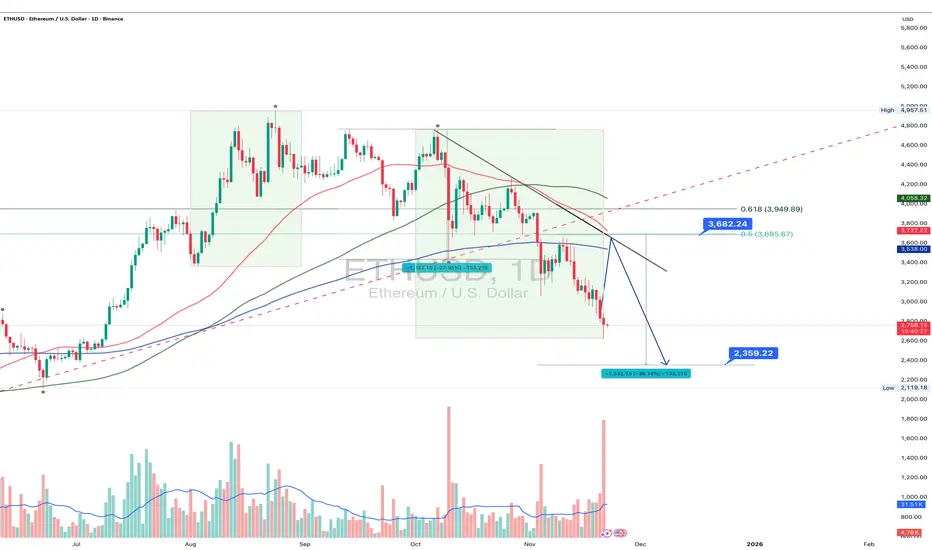
ETH 1D: correction unfolding or just a warm-up?Ethereum continues to trade within a clear bearish structure: after breaking below key daily moving averages, the decline accelerated, pushing the price into the 2720–2800 zone an area that previously acted as a short-term reversal cluster. The trendline from the recent top is broken, and a retest of the 3600–3700 resistance (0.5–0.618 Fib) remains the key scenario before any continuation of the downtrend. Only a confirmed breakout above 3700 would shift the structure back to bullish.
A deeper correction target sits around 2360–2400, where symmetry projections and previous accumulation zones converge.
Fundamental snapshot (Nov 22): network activity is stable, but downward pressure persists due to lower transaction fees and reduced validator revenue. Capital inflows remain weak, and ETH’s dominance continues to erode against L2 networks and alternative L1s. The market is waiting for strong catalysts such as real-world asset tokenization and institutional adoption. In the short term, sentiment leans neutral-to-bearish, supporting the probability of a move toward 2360–2400.
As long as ETH remains below 3600–3700, the bearish scenario holds priority. A breakout above 3700 would flip the structure, but current price action still favors continuation of the correction.
Ethereum is full of surprises - yet price levels tend to be much more disciplined than traders.
ETHUSD : TRADE IDEAAnother short opportunity is on ETH/USD. On the daily timeframe, price has successfully broken below the support level at 3353.41. The recent upward movement appears to be a temporary pullback before continuing its decline toward the 2747.46 level.
Ensure strong confirmation before acting, and keep an eye on shifts in market structure.
Thanks a lot for your support & best of luck
**My trading strategy is not intended to be a signal. It's a process of learning about market structure and sharpening my trading my skills also for my trade journal**

ETH Is Testing the 0.786 Level With DeM at ExhaustionETH is pressing into a major support cluster built from the July 2025 swing low and the readings on the RB DeM indicator are finally reaching exhaustion territory.
The DeM value sitting near 0.18 lines up with the 0.786 retracement of the entire July push which creates a high probability reaction zone.
✓ RB DeM showing deep exhaustion
✓ Price tapping the 0.786 fib from the July 2025 cycle
✓ Structure approaching a level where bigger players usually reload
If buyers defend this zone the next rotation upward could build quickly. I am watching for my RB Swing Setups algo to trigger once momentum shifts.
Full multi timeframe analysis and weekly setups are inside my newsletter.
Link in profile.

Ethereum Slides Deeper as Price Moves Toward 2,750 SupportHello everyone, Ethereum is facing a rather uncomfortable decline after its attempt to recover from the 3,000 USD region failed completely. The price is now hovering around 2,790 USD — the lowest level in over 10 days — and is trading firmly below the Ichimoku cloud, a familiar signal that sellers are still dominating the market.
Observing the price structure on the 4H chart, I see ETH repeatedly leaving red FVGs above, stretching from the 3,000 to 3,200 USD zone. This clearly shows one thing: every recent bounce has been quickly sold off. The market is showing a clear “sell the rally” sentiment, making the short-term downtrend smooth and consistent.
Ethereum is now sliding toward the 2,750 USD zone — a key support area that held price quite well in early November. This is also where liquidity thickens, a region where the market often reacts. But if this level is broken cleanly, the decline could extend toward 2,700–2,650 USD, right at the high-liquidity region and strong support on the D1 timeframe.
News flow also isn’t helping crypto at the moment. The USD is strengthening after September’s jobs report came in far above expectations, raising concerns that the Fed may not cut rates anytime soon. When the dollar becomes more attractive, capital tends to move away from risk assets — and crypto feels the pressure directly. Meanwhile, US equities are recovering strongly thanks to Big Tech and AI stocks, drawing speculative flows away from major coins like ETH.
From my perspective, the highest-probability scenario is that Ethereum continues dropping toward 2,750 USD to test demand. If this area fails to generate a strong enough reaction, price could easily extend lower toward 2,700 USD — a zone where technical buyers may become more active.
What do you think — will Ethereum defend 2,750 USD successfully, or will it need to drop further before recovering?

BOUGHT ETHUSD ON $2,750 @ the 61.8% fibo level, i took my bet to long ETHUSD on its heavy correction.
We will need confirmation on daily chart with bullish candle closing, but i tried to take a little bit risk this time.. AIMING AT LEAST $3,200 to $3,300 area..
LET'S GO...

Eth Short to $1,899 Every single time during it's lifetime, when Eth has closed a daily candle below it's 100 week MA, it has substantially declined. Eth may close a daily candle below today or very soon.
The MA is currently at $3,065.
The declines have been decaying, which gives us a probable 38% drop, which would put the target at $1,899.
Every time that this has happened, eth has failed to close a daily candle above the MA after closing below it.
Enter trade at daily closure below $3,065.
Trade invalidated if we close above the MA on the daily.
Take profit at $1,899, and on the way down.


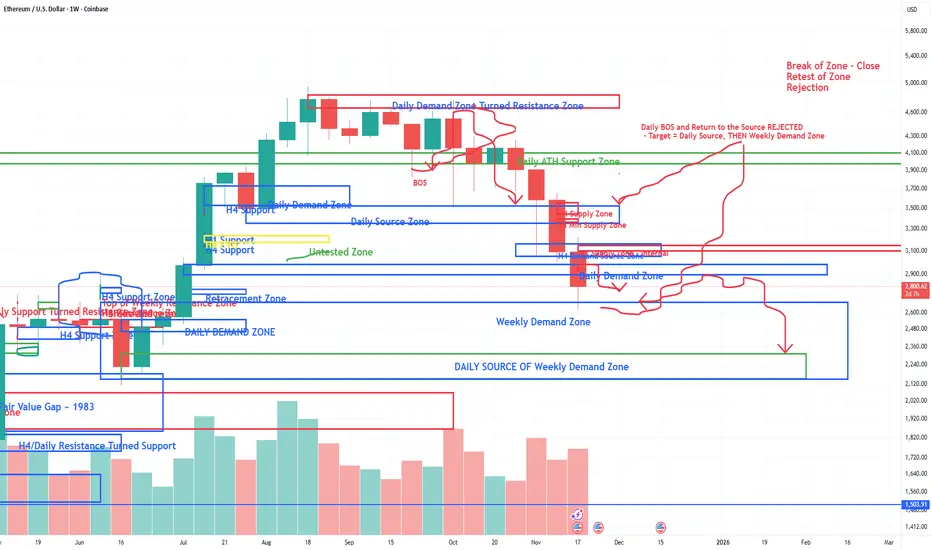
Is the ETH Problem Solved Yet????ETH has traded exactly as expected from this last recent high and break down of structure that followed. Please see my last analysis on ETH from 11/11/25. We have dropped down into this Weekly Demand Zone (2150 - 2680), and are now seeing a bullish response out of it as expected. This response is most likely to pull back up to retest the previous Daily Demand Zone (2900 - 2980) and get Rejected.
The most likely targe of this fall is still to continue to the Daily Source inside of this weekly zone. The problem is that this Weekly Demand Zone was very large, leaving a wide range of buyers in this area. The most concentrated demand will be inside of the Daily Source (2150 - 2314).
This is just the market being the market and following a solid technical analysis structure.
What to look for Next?:
Keep in mind that the overall market is STILL BULLISH. This so called "collapse of the market, flash crash, crypto winter", etc. is only because we extended way too far from the last Weekly Demand Zone. The price of ETH and BTC pushed too far, too fast, and we are only returning to normal market structure. There HAS to be this kind of correction in the market in order to move forward.
So, to resume the bullish case for ETH right now, all we need to see a clear Break of Structure out of this large Weekly Demand Zone on the H4 Time frame. The H4 will be the tell tell sign that the decline is ending. That is most likely to happen within the Daily Source Zone highlighted (2150 - 2314). We need to see a clear H4 Break of the last supply zone and a retest to get out of this 2700 price range area and continue with the overall still bullish trend.
Don't be fooled by these bullish responses right now - we are not ready to go bullish again until we see what I described above. Every other bullish pump right now is a trap, and should be traded accordingly.
ETH selling climax!ETH is approaching its final stages of selling. I will watch how price behaves in the marked fib levels.

ETHUSD TRADING LEVELS#ETHUSD TRADING LEVELS by TrAdiNgSoLiDLeVeLs. Anyone can trade on both sides with a strict stoploss.
Thank You for your support.

ETHUSD oversold & bearish ?The ETHUSD pair continues to display a bearish outlook, in line with the prevailing downward trend. Recent price action suggests a corrective pullback, potentially setting up for another move lower if resistance holds.
Key Level: 2,914
This zone, previously a consolidation area, now acts as a significant resistance level.
A failed test and rejection at 2,914 would likely resume the bearish momentum.
Downside targets include:
2,476 – Initial support
2,400 – Intermediate support
2,330 – Longer-term support level
Bullish Scenario (breakout above 2,914):
A confirmed breakout and daily close above 2,914 would invalidate the bearish setup.
In that case, potential upside resistance levels are:
2,960 – First resistance
3,040 – Further upside target
Conclusion
ETHUSD remains under bearish pressure, with the 2,914 level acting as a key inflection point. As long as price remains below this level, the bias favours further downside. Traders should watch for price confirmation around that level to assess the next move.
This communication is for informational purposes only and should not be viewed as any form of recommendation as to a particular course of action or as investment advice. It is not intended as an offer or solicitation for the purchase or sale of any financial instrument or as an official confirmation of any transaction. Opinions, estimates and assumptions expressed herein are made as of the date of this communication and are subject to change without notice. This communication has been prepared based upon information, including market prices, data and other information, believed to be reliable; however, Trade Nation does not warrant its completeness or accuracy. All market prices and market data contained in or attached to this communication are indicative and subject to change without notice.

BottomETH finally throwing down into both horizontal support and poking through channel support (typical shakeout). RSI in oversold territory. Looking for a large bounce within the channel and breakout shortly after
- QT ends Dec 1
- More rate cuts + Fed chair announcement
- Federal govt reopened
- Clarity Act passing soon

ETH at the Edge! Massive Move ComingBased on your chart, Ethereum is currently sitting right on the lower boundary of the rising blue channel, which is a major decision zone for the next trend.
Bullish Scenario
If ETH holds the lower blue trendline (around $2,400–$2,500):
Bullish Targets
1. $3,200 — mid-channel resistance
2. $3,760 — major structural resistance
3. $4,800 — historical peak & cup-and-handle breakout level
4. $5,500–$6,000 — full bullish channel extension
Confirmation for upside
• Strong reversal candle on the lower channel
• Break & close above the 50-day SMA
Bearish Scenario
If ETH breaks below the lower channel (~$2,400):
Bearish Targets
1. $2,000 — psychological support
2. $1,550 — major previous swing low
3. $1,000–$1,200 — full downside breakdown target
Stop-Loss Recommendation
(To protect against a channel breakdown)
Stop-Loss:
Below $2,350
This is slightly under the lower trendline — if broken, the bullish structure fails.
Trading Plan Summary
• Entry zone: $2,450–$2,600 (channel support region)
• Stop-loss: $2,350
• Take Profit (TP):
• TP1: $3,200
• TP2: $3,760
• TP3: $4,800
• TP4: $5,500–$6,000

ETH PERPETUAL TRADE BUY SETUP Long from $2810ETH PERPETUAL TRADE
BUY SETUP
Long from $2810
Currently $2810
Targeting $2970 or Above
(Trading plan IF ETH
go down to $2750 will add more longs)
Follow the notes for updates
In the event of an early exit,
this analysis will be updated.
Its not a Financial advice

2600-2750 Swing levels on ETHSharing this chart incase anyone might be looking for opportunities in the market.
Basic call outs
Distribution at 4954,
Down trend with mechanical pullbacks,
-Tight range forming as it goes lower
-Key Levels - 2750, 2600

ETHUSD H4 | Bearish ContinuationMomentum: Bearish
Price is moving upward toward the identified sell entry, which aligns with the 50% Fibonacci retracement level and remains positioned below the Ichimoku Cloud, supporting a bearish outlook.
Sell Entry: 3,240.22
Overlap resistance
50% Fibonacci retracement
Below the Ichimoku Cloud
Stop Loss: 3,434.25
Overlap resistance
78.6% Fibonacci retracement
Take Profit: 2,907.19
Pullback support
High Risk Investment Warning
Stratos Markets Limited (tradu.com ), Stratos Europe Ltd (tradu.com ):
CFDs are complex instruments and come with a high risk of losing money rapidly due to leverage. 70% of retail investor accounts lose money when trading CFDs with this provider. You should consider whether you understand how CFDs work and whether you can afford to take the high risk of losing your money.
Stratos Global LLC (tradu.com ): Losses can exceed deposits.
Please be advised that the information presented on TradingView is provided to Tradu (‘Company’, ‘we’) by a third-party provider (‘TFA Global Pte Ltd’). Please be reminded that you are solely responsible for the trading decisions on your account. Any information and/or content is intended entirely for research, educational and informational purposes only and does not constitute investment or consultation advice or investment strategy. The information is not tailored to the investment needs of any specific person and therefore does not involve a consideration of any of the investment objectives, financial situation or needs of any viewer that may receive it. Past performance is not a reliable indicator of future results. Actual results may differ materially from those anticipated in forward-looking or past performance statements. We assume no liability as to the accuracy or completeness of any of the information and/or content provided herein and the Company cannot be held responsible for any omission, mistake nor for any loss or damage including without limitation to any loss of profit which may arise from reliance on any information supplied by TFA Global Pte Ltd.

ETHUSD - Further Bearish Scenario A double top scenario between last bull runs peak and the current action seen is an idea that ive come across.
Price may not go up at all and retest the dotted line in red in a bearish action
I dont expect this as much as I expect the occurrence of a late altcoin bull run.
Weekly chart
