Ethereum - The realistic $15,000 target!🔥Ethereum ( CRYPTO:ETHUSD ) can still break out:
🔎Analysis summary:
Over the past four years, Ethereum has been trading in a massive bullish triangle pattern. And despite the recent all time high rejection, Ethereum can still follow its underlying bullrun. It just has to create the bullish triangle breakout in the foreseeable future.
📝Levels to watch:
$4,000
SwingTraderPhil
SwingTrading.Simplified. | Investing.Simplified. | #LONGTERMVISION
Trade ideas


ETH/USDETH/USD TRADE IDEA – @MIYA_BROTHERS
Market is currently trading inside a rising channel, maintaining a bullish market structure.
Expecting a corrective pullback into demand zones before continuation to the upside.
Key Levels to Watch:
Demand Zone 1: 3510 – 3460
Demand Zone 2: 3380 – 3330
Target Zone: 3600 – 3700+
If price forms a higher low inside the channel and shows bullish confirmation (rejection wick / break & retest), we look for long opportunities.
Bias: Bullish Continuation
Confirmation Required: Yes
Not Financial Advice. Personal analysis only.

ETHUSD oversold rally support at 3,365 The ETHUSD remains in a neutral trend, with recent price action showing signs of an oversold rally within the broader range trading.
Support Zone: 3,365 – a key level from previous consolidation. Price is currently testing or approaching this level.
A bullish rebound from 3,365 would confirm ongoing upside momentum, with potential targets at:
3,940 – initial resistance
4,064 – psychological and structural level
4,200 – extended resistance on the longer-term chart
Bearish Scenario:
A confirmed break and daily close below 3,365 would weaken the bullish outlook and suggest deeper downside risk toward:
3,200 – minor support
3,055 – stronger support and potential demand zone
Outlook:
Bullish bias remains intact while the ETHUSD holds above 3,940 A sustained break below this level could shift momentum to the downside in the short term.
This communication is for informational purposes only and should not be viewed as any form of recommendation as to a particular course of action or as investment advice. It is not intended as an offer or solicitation for the purchase or sale of any financial instrument or as an official confirmation of any transaction. Opinions, estimates and assumptions expressed herein are made as of the date of this communication and are subject to change without notice. This communication has been prepared based upon information, including market prices, data and other information, believed to be reliable; however, Trade Nation does not warrant its completeness or accuracy. All market prices and market data contained in or attached to this communication are indicative and subject to change without notice.

ETHUSDLooks like I was wrong about the top being in.
Maybe another bump to complete bull trap.
Still, when the flood gates open, expect vertical.

ETH/USD — Bears Hold Control Below 3,750 Amid Channel Pressure (Ethereum (ETH/USD) remains under medium-term bearish pressure, continuing to correct within its descending channel against the backdrop of a long-term uptrend.
Last week, the pair tested the 3,125.00 level (Murray , 50% Fibonacci retracement) after temporarily breaking below the channel’s lower boundary but failed to consolidate there.
Currently, ETH is trading near 3,750.00 (Murray ), supported by the midline of the Bollinger Bands. A confirmed breakout above this level could trigger an upward recovery toward the upper boundary of the descending channel near 4,375.00 (Murray ) and potentially 5,000.00 (Murray ).
However, given prevailing sentiment, the base scenario remains bearish — the pair is more likely to resume its decline along the channel’s lower edge, with another possible breakout downward.
For bears, the key level remains 3,125.00. A daily or weekly close below it would likely open the path to 2,500.00 (Murray ) and 2,187.50 (Murray ), extending the correction.
⸻
Technical Outlook
• Bollinger Bands: Pointing downward — confirming strong bearish momentum.
• MACD: Stable in negative territory — trend remains under seller control.
• Stochastic: Rising but already overbought — potential for reversal in the short term.
• Weekly Chart: ETH continues to trade below the Bollinger midline, keeping downside risks intact.
⸻
Support and Resistance
• Resistance: 3,750.00 / 4,375.00 / 5,000.00
• Support: 3,125.00 / 2,500.00 / 2,187.50
⸻
Trading Scenarios
Main Scenario — Sell Stop
• Entry: 3,110.00
• Take Profit: 2,500.00 / 2,187.50
• Stop Loss: 3,540.00
• Bias: Bearish continuation below 3,125.00
• Timeframe: 5–7 days
Alternative Scenario — Buy Stop
• Entry: 3,770.00
• Take Profit: 4,375.00 / 5,000.00
• Stop Loss: 3,360.00
• Bias: Bullish reversal above 3,750.00
⸻
💬 ETH remains technically weak below 3,750.00. A breakdown under 3,125.00 would confirm further downside toward 2,500.00, while a close above 3,750.00 could trigger a short-term recovery toward 4,375.00.

Ethereum Accumulates Near $3,170 SupportFenzoFx—Ethereum is down 0.66% today, trading near $3,540.00 inside the liquidity void from October 10. Immediate support lies at $3,170.00, a level respected for 4 days on the daily chart. This accumulation may signal a potential move higher.
In this scenario, ETH/USD could rise toward $3,836.00 before resuming its downtrend. A break below $3,170.00 would likely trigger a decline toward $2,880.00. The bearish outlook remains valid as long as the daily chart fails to print new higher highs.

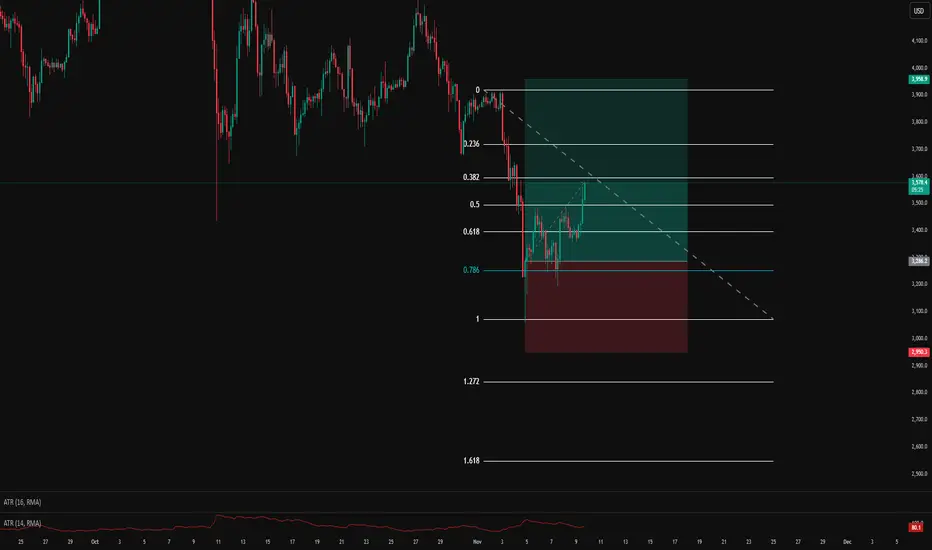
$ETH: Correction has ended?BITSTAMP:ETHUSD : certainly possible that the very last leg of correct ended in three waves. ChatGPT kept telling me a C wave should have 5 waves -- let's see.
If C has ended and therefore II has ended and therefore the correction has ended, then we are now in Wave 1 of a lower degree. This wave itself has 3 subwaves. Wave (4) of 3 backtested resistance and is still in progress.
Looks like this Wave 1 can end at the downsloping trendline and Wave 2 correction will ensue.

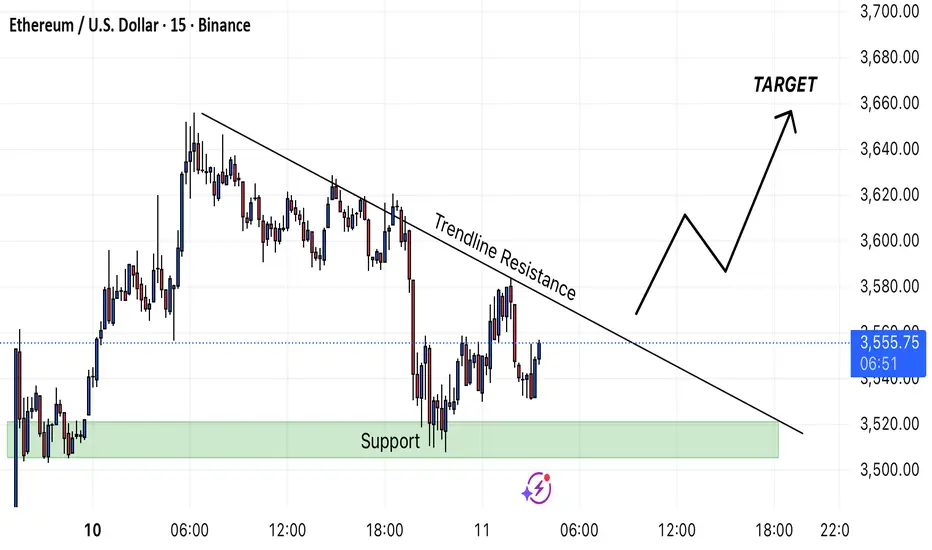
ETH/USDT – Trendline Breakout Setup FormingEthereum is currently consolidating near the $3,550 level after a short-term pullback. Price is moving within a descending trendline acting as dynamic resistance, while the green zone around $3,510–$3,530 is providing a strong support base.
A breakout above the trendline resistance could confirm a shift in short-term momentum, potentially leading to a bullish move toward the $3,650–$3,675 target area.
Key Levels:
Support: $3,510 – $3,530
Resistance: $3,575 – $3,600 (trendline breakout zone)
Target: $3,650 – $3,675
Trading Plan:
Bullish Scenario: Wait for a confirmed breakout and retest of the trendline before entering long positions toward the target zone.
Bearish Scenario: If price rejects the trendline and breaks below support, expect a potential retest of $3,480–$3,500.
Summary:
ETH is showing signs of accumulation at support. A clean breakout above trendline resistance would likely trigger bullish continuation in the short term.
ETH - levels of interestprice bounces between timeframes
yearly levels are black
monthly levels are pink
Weekly are grey
day = red
4hr = orange
maybe we'll see how the timeframes test and target one another.

Ethereum to 5kCurrent range discount area, we have 4h confirmation to going higher, we have liquidity to the buyside, we have weekly and monthly imbalances we we are finding support to push higher, looking for longs

ETH- Quick LongETH $4400-4500 support zone, bullish momentum. I am long for a quick intra-week trade. Be cautious, stop loss tight. ETH could progress lower.

Disbelief Rally Time?A lot of extreme bearish exuberance, but fundamentals continue to go up on the Ethereum network: lower gas fees, record transactions, record stable coin and real-world asset volume (digital treasuries, digital gold, etc). Recipe for a disbelief rally given extreme low sentiment.
Bullish catalysts:
- Fusaka upgrade go-live
- Tariff SCOTUS reversal odds
- Government reopening
- Clarity act progress
- New record network stats
- New dovish economic reports

brrrr - ETH weekly update Nov 10 - 16thThe Deutsche Bank expects the Fed to start printing money in the beginning of December. In addition to that, we already saw a liquidity shortage in the past weeks, with the Fed reacting with a $21B liquidity injection into the system to keep the system running and prevent a bank run. After all that, there is also the massive debt of the US, which can't be paid off properly anymore and needs to be monetized by inflation. These factors lead to this point, where liquidity needs to be injected.
Funding Rates show local highs, suggesting the local top is in. The liquidity heatmap shows liquidity above us, which leads to the thesis that after this move most traders are entering leveraged short positions now. The bottom could be in when Funding Rates flip negative.
The current count as seen on the chart shows that the corrective movement isn't over and this has to reasons:
Firstly, the indicators of the superior timeframe and cycle do not show signs of the end of this corrective movement and secondly, the current structure doesn't show the impulsiveness I'd like to see of a first wave. The alternative scenario is invalidated as we break the red market low, but the chances for the alternative scenario already lowered massively because of the big candle facing downwards.
My favored position here is definitely a short but the chances getting liquidated or stopped out are very high. Stop loss would be at one peercent above the high of the X and take profit at the low of the Z.

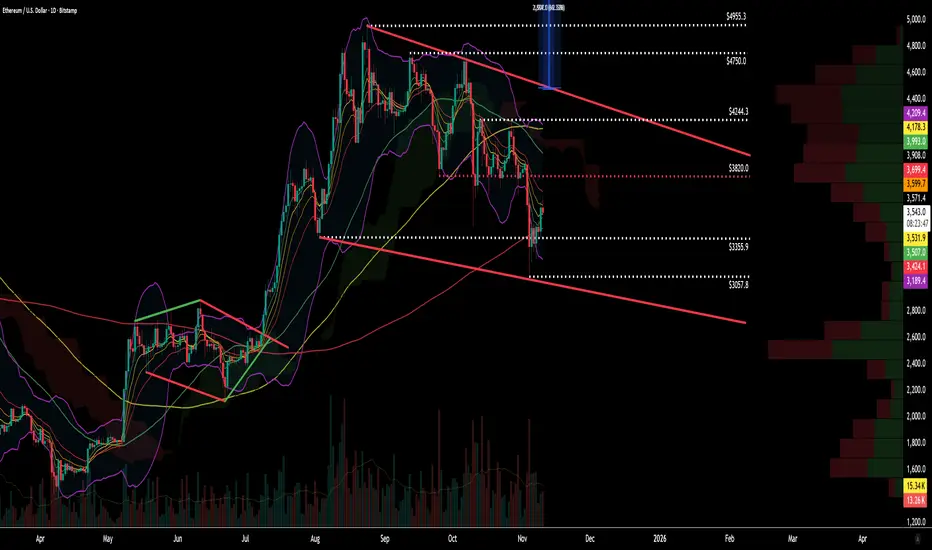
$ETH – Bull Flag Formation & Major Structural SetupSince the Liberation Day Tariffs on April 7th, Ethereum ( CRYPTOCAP:ETH ) has rallied over +257%, peaking in late August before entering a consolidation phase. The structure of this chart has shifted multiple times throughout the year, each time forming new continuation and reversal patterns that have defined the broader trend.
Pattern Evolution
1️⃣ Diamond Continuation (May – July)
Between May and July, CRYPTOCAP:ETH printed a Diamond formation, which often behaves similarly to a symmetrical triangle. The breakout from this pattern came with high volume participation, fueling a sharp rally into late August.
2️⃣ Descending Triangle Breakdown (August – October)
From August through late October, the trend shifted. A Descending Triangle formed, breaking below key support around $3,820.
However, the breakdown failed to achieve its full 1:1 measured move target at $2,675, instead reversing after setting a new low confirmed by a significant volume spike — the highest in nearly a month.
3️⃣ Emerging Bull Flag (August – November)
Since early November, the chart has morphed into a large Bull Flag, encapsulating the entire consolidation since August.
This structure includes multiple resistance layers above, but the consolidation is tightening and volume contracting, typically a precursor to a major breakout attempt.
The measured move projections of both the flagpole and the flag itself point to a substantial upside once price escapes the channel.
Key Resistance & Support Levels
Resistance:
$3,820: Former Descending Triangle support, now acting as resistance
$4,244–$4,245: Major confluence zone at prior swing highs
$4,750: Upper extension of the flag structure
$4,955: August rally high
Support:
$3,356–$3,355: Mid-flag support / prior reaction level
$3,058–$3,057: Lower flag support / key technical base
Technical Summary
✅ Pattern: Diamond → Descending Triangle → Bull Flag
✅ Trend: Broad uptrend consolidating within flag formation
📊 Key Resistance Zones: $3,820 → $4,245 → $4,750
⚠️ Support Zones: $3,355 → $3,057
🎯 Targets:
• Flag projection: $6,390
• Flagpole projection: $7,309
🔍 Trigger: Break and close above $3,820 with expanding volume for early confirmation
Final Notes
Ethereum remains one of the strongest structural setups in the current crypto cycle — consolidating after a multi-month rally and holding well above its mid-year breakout zone.
The bull flag pattern forming across the August–November range has now become the key structure to watch.
A confirmed breakout above $3,820, accompanied by rising volume and broad market strength, could trigger a measured continuation move toward $6,000+.
Conversely, a rejection at resistance or breakdown below $3,055 would invalidate the flag and risk a retest of the lower trendline near $2,800.
Overall, momentum remains constructive, and CRYPTOCAP:ETH continues to build a powerful base for potential long-term continuation once the current compression resolves.
For educational and technical analysis purposes only.
ETH Top Break down Tarhet $ 30000.- to $2500.- betwee 38.2 50ETH Top Break down Tarhet $ 30000.- to $2500.- between 38.2 50
Not for short but accumulation.

#ETH/USDT Ethereum analysis#ETH
The price is moving within an ascending channel on the 1-hour timeframe and is adhering to it well. It is poised to break out strongly and retest the channel.
We have a downtrend line on the RSI indicator that is about to break and retest, which supports the upward move.
There is a key support zone in green at the 3350 price level, representing a strong support point.
We have a trend of consolidation above the 100-period moving average.
Entry price: 3397
First target: 3445
Second target: 3502
Third target: 3570
Don't forget a simple money management rule:
Place your stop-loss order below the green support zone.
Once the first target is reached, save some money and then change your stop-loss order to an entry order.
For any questions, please leave a comment.
Thank you.

ETHUSD 1H | Bullish Continuation Setup🟢 Market Structure
Price holding above key support at 3,600
4H sell-side liquidity taken below
Bullish structure intact with higher lows
🔵 Key Support Levels
Immediate Support: 3,600 - 3,610 (current zone)
Primary Support: 3,583 - 3,594 (consolidation base)
Strong Support: 3,549 (momentum defense)
🎯 Entry Zones & Targets
🟡 Primary Entry: 3,605 - 3,615 (current retest)
🟠 Secondary Entry: 3,583 - 3,594 (deeper retest)
🔴 Stop Loss: Below 3,548 (support break)
💰 Take Profit Targets
TP1: 3,637 - 3,650 (immediate resistance)
TP2: 3,700 - 3,720 (momentum extension)
TP3: 3,800 - 3,856 (liquidity zone)
⚡ Trade Management
Scale entries on support retests
Move SL to breakeven at TP1
Partial profits at each target
Bullish continuation expected - buying dips toward support
#ETH #Ethereum #TradingView #Bullish #Crypto

ETH/USD Bearish breakdown selling strong📉 ETH/USD Update – Technical Breakdown Alert
After facing strong resistance around $3,450, Ethereum (ETH/USD) has confirmed a bullish trend breakdown, now moving into a strong downtrend on the 15-minute timeframe.
🔹 Resistance: $3,450
🔹 Immediate Supports:
$3,275
$3,175
$3,101
⚠️ Technical Outlook:
Selling pressure is increasing as ETH fails to sustain above resistance. Price action suggests further downside potential if support zones fail to hold.
💡 Trading Tip:
Maintain strict risk management — use stop losses and manage position size carefully.
📊 Trend: Bearish (short-term)
🕒 Timeframe: 15 Min
Like 👍 | Follow 🔔 | Comment 💬 | Share 🔁
Stay updated with real-time crypto insights!

#ETHUSD can see one more leg lower?BINANCE:ETHUSD We believe ETHUSD can see one more push lower to complete pending move in #BTCUSD, it looks risky as crypto on high bullish trend. Can play small quantity and see if it could turn out. Or Safe traders can accumulate ETHUSD if it makes one more push lower.

ETHUSDUncertain how far down this ledgendary crypto will fall...
But I think we just locked in the top @ ~$3656.

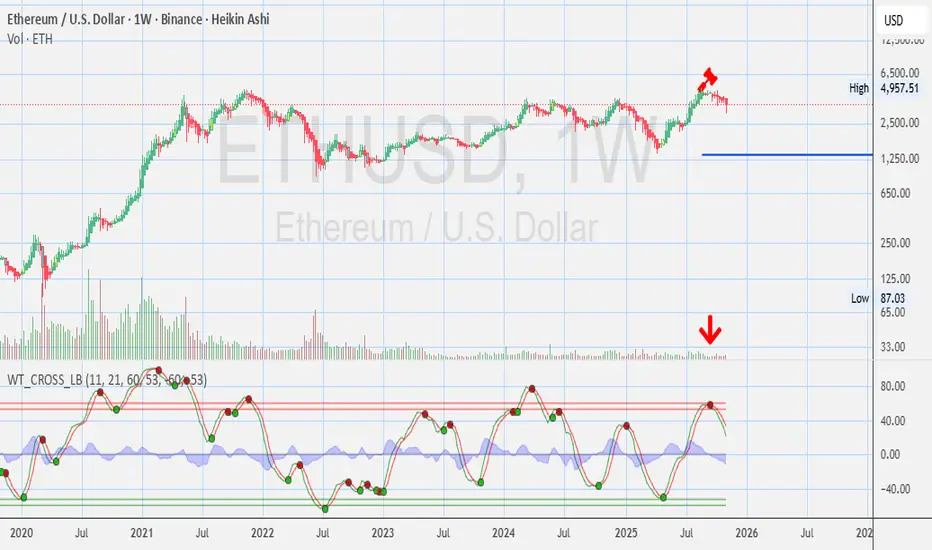
ETH - Ethereum Weekly Chart - Opinions? Disclosures :
This analysis is for informational purposes only and is not financial advice. It does not constitute a recommendation to buy, sell, or trade any securities, cryptocurrencies, or stocks. Trading involves significant risk, and you should consult with a qualified financial advisor before making any investment decisions. Past performance is not indicative of future results. Always DYOR
Coinciding with Bitcoin, it's time for an upsurge.We entered a buy order on Ethereum after observing oversold conditions on the Relative Strength Index (RSI), coinciding with oversold conditions on Bitcoin. A buy signal was formed between bars, and based on the volatility calculation using ATR, the take-profit and stop-loss levels were determined. Good luck to everyone.