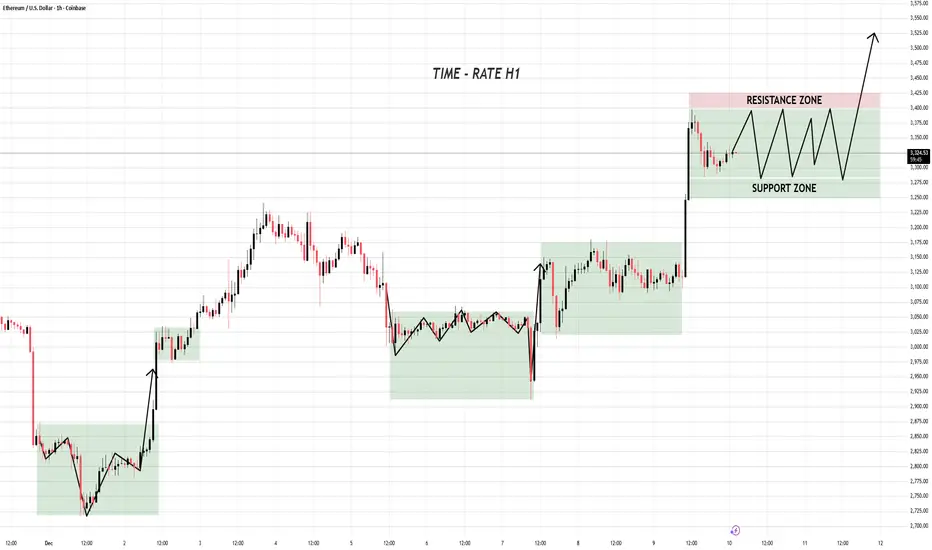
Here’s How ETH Is Preparing for Its Next Expansion Move📊 MARKET STRUCTURE BREAKDOWN (H1)
1️⃣ Accumulation Phase
- Price built a clear base (sideways box).
- Liquidity swept → breakout → strong impulsive leg upward.
- This is classic accumulation → expansion.
2️⃣ Second Accumulation
Very similar structure:
- Compression inside the box
- Sharp liquidity flush
- V-shaped recovery → bullish breakout
This confirms institutional accumulation behavior.
3️⃣ Current Structure (Right Range)
You marked SUPPORT ZONE & RESISTANCE ZONE.
ETH is repeating the same playbook:
- Long wick rejection into Support
- Price oscillates inside the range (liquidity creation)
- A breakout is likely to follow once enough orders are collected.
This is the third accumulation cycle — textbook bullish continuation.
🎯 TRADING SIGNAL
BUY SETUP
Entry Zone:
3310 – 3350 (Support Zone dips / liquidity sweeps)
Stop Loss:
Below support box: 3250
Take Profit:
Partial at 3450–3500
Full target at 3600+ (expected breakout continuation)
Why this works:
ETH has shown the exact pattern twice:
Range → Liquidity Sweep → Expansion.
Current price is building the third range — probability favors another upward expansion.
📈 SUMMARY:
ETH is not random it is systematically accumulating before each major pump.
As long as price holds the Support Zone and continues ranging, the bullish continuation scenario remains the highest-probability play.
Trade ideas
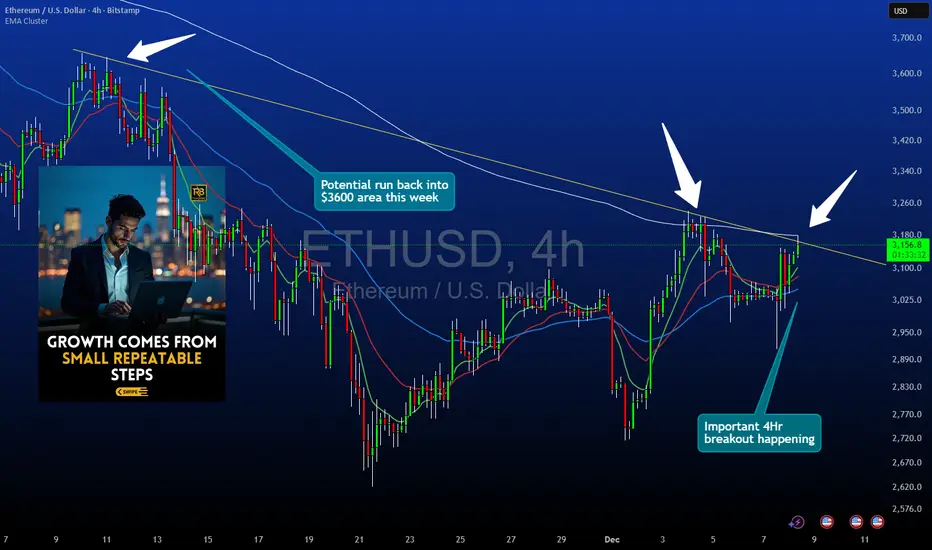
Ethereum 4HR Structure UpdateThis idea focuses on Ethereum on the 4 hour chart.
Price is approaching a descending trendline that has acted as dynamic resistance. A break and confirmed close above this trendline is required before considering any long setups.
Key Levels and Structure
• Primary focus is the descending trendline that has capped every recent bounce
• A full candle close above the trendline is essential before any entry is planned
• The upside reference area for this idea is near 3600 where prior reactions occurred
• Invalidations sit below 2950 which would represent a break beneath the recent structural base
Entry Logic
This setup is based on confirmation rather than anticipation.
• No entries should be taken while price remains under the trendline
• A strong bullish close outside the trendline is needed
• Weak closes or wicks through the trendline without body confirmation do not qualify
• The idea is only valid once the trendline is clearly violated on a closing basis
Why the Close Matters
Closing outside the trendline shows that market participants have accepted price above the descending structure rather than briefly testing it. This helps filter false breaks and reduces reliance on intrabar volatility.
Risk Parameters
Stops would be referenced below 2950 since a move under that area would indicate failure to hold recent structural support. The 3600 region is used as the first upside reference point based on previous reactions on the 4 hour chart.
Notes
This idea evaluates structural behavior and does not forecast future performance. Users should confirm levels and apply their own risk management plan before taking any trade.
ETHUSD Bearish BatETH is completing a Bearish Bat pattern at the 0.886 retracement near 3,476, coinciding with prior supply, bearish RSI divergence, and a low-volume node overhead. The harmonic pattern aligns with structural liquidity and fib extensions that indicate likely exhaustion.
Prediction:
Expect rejection and reversal from the 3,450–3,500 PRZ, with downside targets toward 3,150, 3,000, and potentially 2,800.
Entry:
Short at 3,450–3,500 (aggressive) or after confirmation (conservative).

ETH Trade Plan (December 10, 2025)ETH Trade Plan (December 10, 2025)
(D1 / H4 / H1 / M15)
⬛️ 1. Higher Timeframe Context (D1 and H4)
• D1 bias: bullish
• D1 range (approx): $3,000 – $4,000
• Key D1 zones:
• Supply: $3,800–$4,000 (historical resistance)
• Demand: $3,000–$3,300
• H4 bias: buy dips
• H4 zones of interest:
• H4 Sell Zone 1: – highs cluster
• H4 Buy Zone 1: – OB + demand
Active setups are trend-aligned with D1/H4.
⬛️ 2. Preferred Setups by Horizon
🔳 2.1 Swing Setup (D1/H4)
• Idea: Buy dips to $3,300 for $4,000+ (trend-aligned).
• Time horizon: multi-day.
• Context: Macro risk-on + on-chain strength.
🔲 2.2 Intraday Setup (H1 focus)
• Idea: Long above $3,370.
• Time horizon: intraday.
• Context: H4 impulse + rally regime.
▫️ 2.3 Scalp Setup (M15 focus)
• Idea: Buy pullbacks to $3,350 with absorption.
• Time horizon: minutes–hours.
▪️ 2.4 Arbitrage/Pairs Concept (if relevant)
• Long ETH/BTC – outperforming bias.
⬛️ 3. Entry Zones and Triggers
🟩 3.1 Long Setup (Trend-Aligned)
• Execution timeframe: H1
• Trigger timeframe: M15
• Entry zone:
• Context: H4 demand, whale flows supportive.
• Pattern tags:
Trigger conditions:
• Reclaim above $3,370 with positive delta.
• ML-Predictive (15m): upside ≥ downside.
• No extreme risk flags.
🔴 4. Stops (Invalidation Levels)
Long setups:
• Stop: $3,300.
• Logic: Break of demand; idea wrong below.
🟢 5. Targets
Long:
• TP1: $3,500 – H1 extension.
• TP2: $3,800 – H4 supply.
• TP3 (optional): $4,000 – D1 objective.
⬛️ 6. Position Sizing
• Baseline risk:
• Trend-aligned setups: 1.0.
• Adjust: low uncertainty + high alignment.
Final: 1.0 for trend long.
⬛️ 7. Risk Flags
• Put skew volatility.
• Fed event risk.
• High OI crowding.
⬛️ 8. Flip Conditions
• Long to bear: Close below $3,300 + negative funding.
⬛️ 9. Alternative Scenario
Rejection at $3,800: double top, short zone $3,750–$3,800, stop $3,850, targets $3,500/$3,300. Differs as failed breakout vs continuation.
⬛️ 10. Model Self-Critique
• Assumptions: Rally sustains on macro, no Fed surprise.
• Vulnerabilities: Sudden risk-off, misinterpreted flows.
• Do not chase highs without confirmation.
⬛️ 11. Uncertainty and Constraints
• Uncertainty.level: low.

On the 5th Day of ETHmas...a Pulllback to the H4 Demand Zone!ON THE 5TH DAY OF ETHMAS, MY TRUE LOVE GAVE TO ME....A PULLBACK TO THE H4 DEMAND ZONE....
OK, so our ETH trading plan is playing out as expected. Please see my previous posts from the first part of November until now to see how we got here. Since the last post, we have pushed up to our first TP Target and moved all the way up to the Daily Zone. This is a Daily Supply Zone, so it is expected to show some resistance.
Where are we now:
At this point, the market is struggling between the H4 BOS UP and Return to the Source that signaled its time to buy again...and this Daily Supply Zone that is saying..."Not so fast...you have to get past ME first".
Why This Matters:
A Daily Supply Zone is still stacked with sellers waiting to push the price back down. So, it will take some strength from this H4 momentum to break past the Daily Zone. It almost never does this the first time, and is extremely rare to do it without building a solid floor on the way up. All we are seeing right now is ETH pulling back to the H4 Demand Zone. We had several strong H4 bull candles up, and there was not a Demand Zone in place until this one around 2975 -3025. The market HAS to pull back to these type of zones for the strength to continue.
What to Expect from here:
At or inside of this H4 Demand Zone, we need to see confirmation that the buyers are really ready to push this back up. We need to watch the 15 min time frame and look for a 15 Min BOS UP outside of this H4 Demand Zone, Plus a strong retest and bullish rejection out of the zone. The 15 min will show us this first. Ideally, we also want to see an H4 Candle close back up above this zone and retest as well. With that signal, we are back to the bullish trend and headed for the H4 Supply Source as shown before...(3450 - 3560).
Now, the Daily Supply Zone that threw this down to start with will STILL NEED TO BE TESTED AGAIN, so expect more resistance if we push back up to it (3108 - 3215). We need to break through the bottom level first and then retest the top (this recent high of ~3215).
A rejection again at this Daily Supply Zone is going to lead to all future Christmas gifts being cancelled. OR a break of this H4 Demand Zone were in now will lead to the same. This is a MUST HOLD area for the bulls now! If this zone fails...."Nobody's Gettin' Nuttin for ETHmas!"

ETH · Fusaka Upgrade & The Calm Before the BreakoutEthereum COINBASE:ETHUSD just stepped into one of its biggest milestones - the Fusaka upgrade - and unlike previous major updates, this one came with a surprising twist. Instead of crashing or swinging wildly like we saw during Dencun and Pectra, ETH actually bounced back toward $3.2k after weeks of decline.
A small recovery, yes… but the kind that feels meaningful.
To me, buying ETH here feels similar to buying gold TVC:GOLD when it was sitting at $1.8k, a moment where the market is exhausted, price is undervalued, and smart accumulation quietly begins.
From a technical analysis perspective, the long-term chart shows something incredibly important - a massive ascending triangle forming for years. Higher lows continue to build pressure from below, while a nearly untouched resistance zone acts as the ceiling.
Short-term price action adds even more fuel to this setup. ETH is once again bouncing at the same demand zone that has held firm multiple times this year. The latest dip formed a double bottom right inside that support block, which is a classic bullish reversal pattern in technical analysis.
ETH may still go sideways a bit longer, higher lows often take time to form, but the overall structure looks like a coiled spring.
Whether you’re a short-term trader or long-term holder, this zone marks as confirmation for uptrend of EH
TheCryptoFire
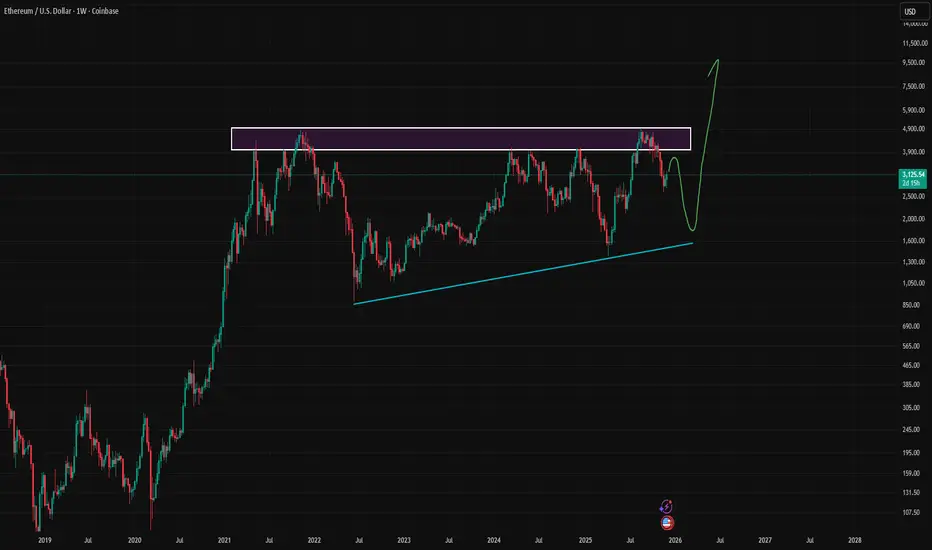
Macro ExpansionEthereum 3 Macro Expansion Cycles.
Ethereum’s cycles have progressed based on accumulation and expansion.
Ethereum’s macro cycles follow a repeating pattern of Accumulation , Expansion & Accumulation , Expansion...
Right now, ETH is in its third major accumulation phase.
If this three cycle structure holds, Ethereum could reach a peak anywhere between $15K–$30K in its next ATH .
The accumulation cycles are becoming longer over time, and in my opinion, this is one of the signs that cryptocurrency cycles are moving away from the traditional 4-year structure.
Let’s see what happens.

Monthly Analysis:Ethereum (ETH), Issue 280 The analyst expects Ethereum’s price to decline by the specified end time (countdown timer), based on quantitative analysis.
The take-profit level simply represents a potential price range during this period — it’s optional and not a guarantee that the price will reach it.
You don’t need to go all-in or use leverage to trade wisely.
Allocating only a portion of your capital helps keep overall risk low.
Our approach follows institutional portfolio management principles — not the “all-in or blow-up” style often promoted on social media.
Performance is evaluated over the entire time window, regardless of whether the take-profit level is hit.
The validity of this analysis is based on a specific time range (until 04 Jan 2025), and after this period, the analysis will be reviewed and updated (once every 28 days).
Monthly Analysis:Ethereum (ETH), Issue 280

Fusaka Upgrade Drops Today — Can ETH Repeat the Pectra Rally?COINBASE:ETHUSD has climbed more than 13% since December 1, and the chart now shows a structure very similar to the one that appeared before the 56% Pectra rally in May 2025. Back then, ETH printed a standard bullish divergence (price made a lower low while RSI made a higher low). The same signal has formed again between November 4 and December 1, hinting at fading seller strength ahead of today’s Fusaka upgrade.
ETH now sits just under the key resistance at $3,166. A clean breakout above this level opens room toward $3,653, and if momentum expands, the Pectra-style extension targets the $4,262 zone.
If the rally stalls, support sits at $2,996, followed by $2,873. Losing these levels weakens the structure and exposes $2,618.
For now, COINBASE:ETHUSD , holds a constructive setup:
• Bullish divergence confirmed
• Momentum improving into the upgrade
• $3,166 remains the decision level
A break above it decides whether Fusaka lights the next big leg.

I'm Dreaming of a White (Bullish) ETHmas!!!!OK, so December is here and ETH has been playing out perfectly. These sharp moves up and down have been all part of the market moving the way the market moves! As we've said before....forget about the talks of Tariffs, Shutdowns, Microstrategy delistings, etc. This market is moving according to solid market structure that we follow and teach. Please see our last Postings on ETH throughout November to see how we've projected these moves almost to a T.
Where are we now?:
At the last post, ETH had made an H4 Break of Structure (BOS) Up, signaling that we were finally seeing either an end, or at least a significant slow down to this bleeding. As expected, this H4 BOS up was going to drive the price back down once more to the H4 BOS Source (~2650 - 2750) for a strong buy. The market fell exactly to this range, and we saw an immediate bullish response back up. This bull push has led us back up to the top of the H4 Supply Zone for a retest.
What to look for next?:
Now that we are back to this H4 Supply Zone, many may be expecting another hard slap from the Bears, BUT, the market has already tipped its hand by giving us that initial BOS Up. We returned to the Source of that break for strength, so there is VERY LITTLE chance that this H4 Zone will hold the price anymore. In fact, the next target is the H1 Supply Source (3155 - 3220), which is an internal structure zone that still will not stop the price. The market is headed for the H4 Supply Source (3450 - 3560) for the 1st Real and Significant test of whether the Bull Run has resumed. A Strong test of this area is the determining factor. If we get a break above and retest of this zone, there is literally nothing to stop ETH from returning to the Daily Support - Now Turned Resistance Zone of 4,000 - 4,100.
So, Will there be a White Christmas for ETH?:
The H4 is pretty much driving the action right now, so any trades should be focused on that time frame until we hit the higher Daily Zone mentioned above. Expect the price of ETH to keep climbing through December, at least up to these zones. It could take a few days or even weeks to make this progress up, but the market has already signaled that it is coming.
Shorter trades opportunities should be abundant on the 15 min as the market makes its way up. Look for 15 Min Demand Zones and wait for the pullbacks to those zones to join the trend.

Ethereum Could Lead the Next Tokenization BoomEthereum could be at the center of the next big crypto cycle. It has strong long‑term potential, even after big price drops.
Tokenization
In the 70s the dollar left the gold standard, and Wall Street built new products like money‑market funds and futures to keep the dollar dominant.
Today something similar is happening with stablecoins: they turn the dollar into a 24/7 digital token on a blockchain, usually backed by US Treasuries.
If dollars can be tokens, then in time stocks, bonds and other assets can also be tokenized and traded all the time, not just during normal market hours.
Why Ethereum
Bitcoin is treated like “digital gold” mainly a store of value.
Ethereum is a smart‑contract platform. It lets people build apps, tokenize assets and run code directly on the chain.
Big banks and asset managers will need a smart‑contract chain for tokenized products, and Ethereum’s size, developer base and track record give it an edge, even though other blockchains may also grow.
Conclusion
Ethereum it is more than just a coin, it is a programmable blockchain where money, apps, and real‑world assets can all live together. As more dollars, stocks, bonds and other assets get “tokenized” so they can trade 24/7, big investors and banks will need a reliable smart‑contract platform, and today Ethereum is the largest and most proven option with a huge developer community.
ETHUSD | Let that sink in...Understand the chartTL;DR: This chart looks like what happened in 2021 in a ridiculous way. A breakout, a rejection, a relief rally, then a painful descent through layered support zones.
I really don’t want to be the guy who says “I told you so” but charts teach with loss as often as profit.
Look at what happened when ETH reached ATH in 2021. A clear breakout and immediate rejection. Price then collapsed with multiple spikes to trick HODLers and bull for life traders.
----------------------------------------------
The lesson the chart here to offer
If our analysis is correct, we’ll see a short-lived manipulation into resistance ($3.6–$4.0k) that will suck in all longs.
What happens next you may ask? Straight down to support zones.
Breaking one support usually leads to the next.
----------------------------------------------
Practical rules to survive this (educational only):
Assume rallies are traps until proven otherwise. Wait for structure (higher lows + higher highs) on higher timeframes before adding long positions.
Manage size. If you trade this, keep position sizing small and protect capital with stops and trailing stops when in a winning trade.
Use multi-timeframe confirmation. Don’t buy solely on daily candles. Micro structure of a daily candle forms on smaller timeframes.
If you want to accumulate, always scale. Don’t all-in. That way you better position yourself, increase your profit and decrease your loss
As always...Stay disciplined.
----------------------------------------------
Good Luck!
P.S: Check the linked idea for a better understanding.

ETH Is Entering the Trap Zone…ETHUSD Market Analysis – Price Is Entering a Make-or-Break Zone
1. Current Market Structure
- ETH has broken the previous downtrend (breakout from the descending trendline).
- After the breakout, price moved into the Moving Price Zone, consolidating inside an expanding channel.
- Price is now touching the RESISTANCE ZONE, showing clear signs of buying exhaustion.
- The SUPPORT ZONE below (green area) remains the key liquidity zone where strong demand has appeared before.
2. Today’s Scenario (Main Outlook)
🔹 Main Scenario – Bearish Reaction From Resistance
- ETH is likely to:
-Continue to move sideways inside the resistance area → a sign of fading bullish momentum.
-Then initiate a strong corrective drop, following the expanding wedge structure.
-Expected downward targets:
+ First support area
+ Or deeper → the main SUPPORT ZONE to collect liquidity.
Reasons:
- The resistance zone is too strong → multiple rejections.
- Price structure resembles a “distribution zone.”
- The current rising channel after breakout is only a temporary recovery.
3. Market Psychology
Traders turn cautious as ETH enters a major resistance area.
Smart money tends to distribute positions at high prices → leading to sideways top formation.
Buying liquidity weakens the closer price moves to resistance.
This hesitation often precedes a sharp correction phase.
4. Trading Outlook (Intraday)
📌 SELL Zone (High Probability)
3380 – 3420
TP1: 3230
TP2: 3050
SL: 3460
📌 BUY Zone (Re-entry – Low Risk)
2720 – 2800
TP: 2980 – 3050
SL: 2660
5. Conclusion
ETH is approaching a critical decision point:
Priority scenario: Sideways at resistance → followed by a downward move to support.
Bullish continuation only becomes valid if ETH breaks above 3440 with strong volume..
Stay patient. Smart money wins by waiting, not chasing. The next big move will reward discipline.

EthereumETHUSD
- Falling Wedge as an corrective pattern in Long Time Frame
- Demand Zone
- Order Block
- Completed " 123 " Impulsive Waves
- Fibonacci Level - 38.20% / 50.00%

ETH Is Quietly Loading Up Power — Are You Ready for....Most traders get trapped during sideways markets because they don’t understand what the structure is preparing for.
This ETH chart reveals a very clear accumulation pattern and those who can read these signals early will position themselves before the breakout happens.
📌 1. Market Structure
- ETH is currently moving inside a third consecutive sideways zone, showing repeated accumulation phases.
- Each consolidation has produced a higher low afterward, forming a clean uptrend continuation structure.
- Price is respecting the dotted uptrend line, confirming buyers are still in control.
📌 2. Key Zones
Sideway Zone #1: ~3,140 – 3,210
Sideway Zone #2: ~3,020 – 3,070
Sideway Zone #3 (current): ~3,080 – 3,170
This third sideways block is the most important — it’s forming right at the uptrend support, signaling smart money accumulation before the next push.
📌 3. Price Action
- Strong recovery from the previous support sweep.
- Price created a sharp HL bounce, then moved sideways again a common bullish re-accumulation pattern.
- ETH is currently compressing inside the range, forming smaller internal highs and lows typical behavior before a breakout.
- Projection (green path) shows a series of higher lows forming inside the zone before price expands upward.
This structure shows balanced liquidity absorption bullish.
📌 4. Technical Confirmation
- The dotted uptrend line is acting as dynamic support.
- Multiple wick rejections from the lower side of the range show buyers aggressively defending.
- Volatility is contracting — a textbook sign of pre-breakout compression.
- No bearish structure change unless price breaks below the uptrend line.
Everything aligns with a bullish continuation leg.
📌 5. Trading Plan (Entry – SL – TP)
🎯 Long Position Setup
Entry: 3,085 – 3,110 (lower side of current range)
Stop-Loss: 3,045 (below range + below uptrend line)
Take Profit 1: 3,165
Take Profit 2: 3,210
Final Target: 3,260+
Why it works:
You buy at the bottom of the re-accumulation while the uptrend line protects structure and range compression leads to an expansion move.

eth still dumping we are grinding down not being able to break resistance .in the smaller time it looks as if we will be seeing a 30% drop from current price especially if we dont break resistance line . the next major support sitting at 2200 this will give us 30% more to the down side . all im waiting for is conformation on smaller time to see a rejection from resistance.if this happens we will get a smack down. to invalidate this we would need a break of structure and see us go up to 4200 and only then will i go bullish . as of now this is looking ugly.

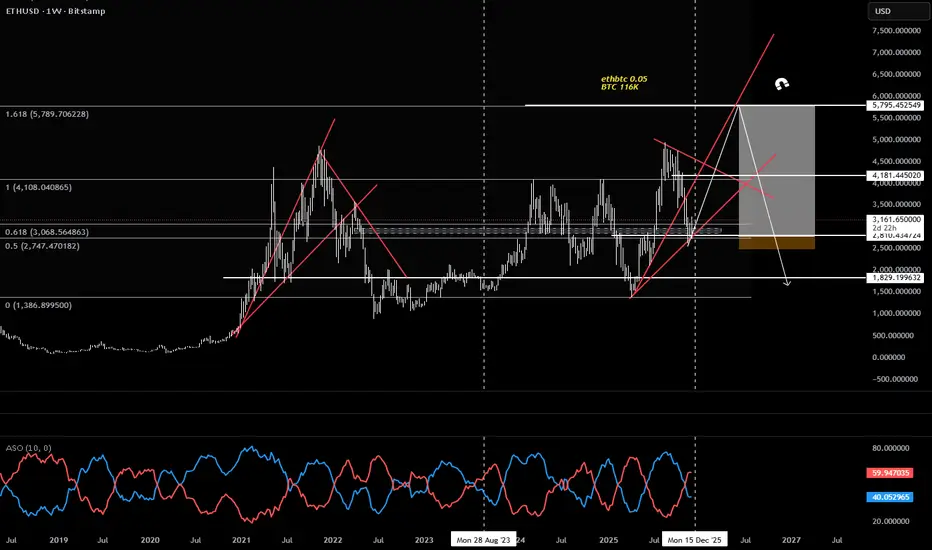
ETH 2 Scenario ETHBTC Chart is clear as day , its reversing back to 0.06 area region
Knowing ethbtc 0.06 now we can have at least 2 cases
IF BTC is at 140K back there are chances where ETH hit 8.3k
IF BTC rejecting 104K and enter 4 year cycle bear market ETH have a change to at least hit 5.5K max
But looking in chart, there are 2 obvious pattern we can generate which is
1. H&S heading to 8.3k
2. Weird Cup and Handle to 8.3k
We will revisit this again in 6 months time
Either way , 2026 is clearly 4 year cycle, but will there be a shock ? just like how no altseason shock?
market maker decide.

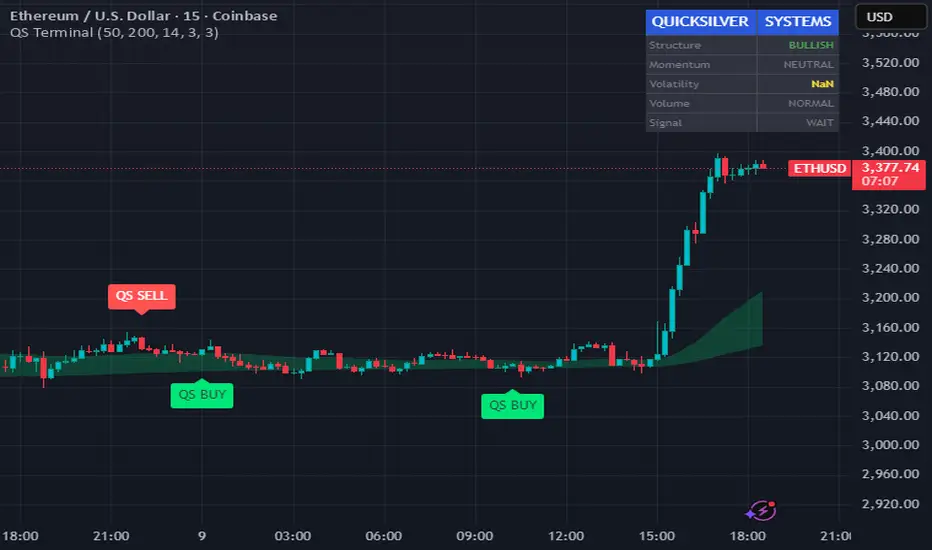
Quicksilver Master Terminal (15min)Overview
The Quicksilver Master Terminal is a comprehensive data visualization interface designed to bring institutional-grade market awareness to the retail chart. It replaces the need for multiple cluttered indicators by consolidating Trend, Momentum, Volatility, and Structure into a single Heads-Up Display (HUD).
Designed by Quicksilver Algo Systems, this tool is engineered for precision scalpers and prop firm traders who require instant situational awareness without switching timeframes.
Features
1. The Institutional HUD (Heads-Up Display)
Located in the top-right corner, this live dashboard provides real-time metrics on:
Market Structure: Instantly identifies if the asset is in a Bullish or Bearish regime relative to the 200 EMA.
Momentum Status: Tracks overbought/oversold conditions using smoothed Stochastic logic.
Volatility (ATR): Displays live Average True Range data for precise Stop Loss placement.
Volume Flow: Detects institutional volume spikes (1.5x average).
2. The Trend Cloud
A dynamic visual ribbon that fills the space between the Fast EMA (50) and Slow EMA (200).
Green Cloud: Strong Bullish Trend (Look for Longs).
Red Cloud: Strong Bearish Trend (Look for Shorts).
Cross: Visual warning of trend reversals.
3. Sniper Signal Logic
The script paints "INSTITUTIONAL BUY" and "INSTITUTIONAL SELL" labels only when high-probability confluence occurs:
Exhaustion: Stochastic RSI breaches extreme levels (<20 or >80).
Confirmation: Price action aligns with Heikin Ashi smoothing to filter noise.
Momentum: Fast %K crosses Slow %D.
How to Use
For Scalping (1m - 5m): Wait for the Trend Cloud to align with the Signal. Take "BUY" signals only when the Cloud is Green.
For Risk Management: Use the live "Volatility" number in the HUD to set your Stop Loss (e.g., 1.5x the current Volatility value).
About the Developer
This script is part of the Quicksilver Ecosystem. We build algorithmic solutions focused on capital preservation and risk management for funded traders.
Disclaimer: This tool is for educational market analysis only. Past performance is not indicative of future results.
ETHUSDT Trade Plan (December 8, 2025)ETH Trade Plan (December 8, 2025)
(D1 / H4 / H1 / M15)
⬛️ 1. Higher Timeframe Context (D1 and H4)
• D1 bias: neutral (bullish reversal attempt)
• D1 range (approx): $2,800 – $3,762
• Key D1 zones:
• Supply: $3,350–$3,762 (previous breakdown + OB cluster)
• Demand: $2,800–$3,050
• H4 bias: buy dips
• H4 zones of interest:
• H4 Sell Zone 1: – previous rejection cluster (decaying)
• H4 Buy Zone 1: – OB + HVN + weekend absorption
All active setups are trend-aligned with emerging H4/D1 bullish structure.
⬛️ 2. Preferred Setups by Horizon
🔳 2.1 Swing Setup (D1/H4)
• Idea: Long dips into $3,100–$3,150 for retest $3,500+ (post-Fusaka accumulation).
• Time horizon: multi-day.
🔲 2.2 Intraday Setup (H1 focus)
• Idea: Long reclaim/break $3,150–$3,190 zone.
• Time horizon: today / overnight.
▫️ 2.3 Scalp Setup (M15 focus)
• Idea: Dip-buy $3,100–$3,110 with absorption or breakout >$3,140.
• Time horizon: minutes–hours.
▪️ 2.4 Arbitrage/Pairs Concept
• Long ETH/BTC ratio – defending key support, mean-reversion bias up.
🟩 3. Entry Zones and Triggers
Main Long Setup (Trend-Aligned)
• Execution timeframe: H1
• Trigger timeframe: M15/M5
• Entry zone:
• Context: H4 demand + weekend sweep reclaim + institutional spot buying
• Pattern tags:
Trigger conditions:
• Price holds $3,100 bid cluster + M15 bullish structure (higher low + volume delta buy)
• CVD positive or diverging bullish
• ML-Predictive 15m upside prob ≥0.65
• No aggressive ask walls rebuilding
🔴 4. Stops (Invalidation Levels)
Long setups:
• Stop: $3,045 (below weekend low + H4 demand)
• Logic: Structural failure, CHoCH down confirmed.
🟢 5. Targets
Long:
• TP1: $3,190 – local supply + FVG fill (H1/H4)
• TP2: $3,350 – supply retest + LVN void (H4/D1)
• TP3 (swing): $3,600+ – next HVN + extension (D1)
⬛️ 6. Position Sizing
• Baseline risk trend-aligned: 1.0%
• Adjustments: −0.2× (put skew + weekend tail) +0.1× (strong absorption + news)
• Effective risk: 0.9% main long, max 0.4% aggressive scalps
⬛️ 7. Risk Flags
• Persistent put skew → vol expansion downside risk
• Weekend liquidity memory (potential gap lower Asia)
• High OI + neutral funding → crowded long risk if macro flips
• Death cross D1 still active (macro timeframe bearish pressure)
⬛️ 8. Flip Conditions
Bull → bear flip: H4 close < $3,050 + CVD strongly negative + funding negative.
⬛️ 9. Alternative Scenario
Fakeout above $3,190 → sharp rejection (spoofing + gamma) → trap longs → drop to $2,950–$3,000 (next demand + round number). Requires delta selling + macro risk-off trigger.
⬛️ 10. Model Self-Critique
• Main assumptions: Fusaka narrative sustains buying, institutional accumulation continues, no macro shock.
• Vulnerabilities: put skew buyers re-assert, whale distribution at supply, weekend gap lower, misread absorption.
• Do NOT chase extended above $3,200 without volume. Do NOT hold through Asia low liquidity without tight stops.
⬛️ 11. Uncertainty and Constraints
Uncertainty: medium
Constraints: require M15 confirmation + positive delta, no entries above $3,200, reduce size into NY close if no volume.

ETHUSD resistance retest at 3,246The ETHUSD pair continues to display a bearish outlook, in line with the prevailing downward trend. Recent price action suggests a corrective pullback, potentially setting up for another move lower if resistance holds.
Key Level: 3,246
This zone, previously a consolidation area, now acts as a significant resistance level.
A failed test and rejection at 3,246 would likely resume the bearish momentum.
Downside targets include:
2,860 – Initial support
2,777 – Intermediate support
2,670 – Longer-term support level
Bullish Scenario (breakout above 3,246):
A confirmed breakout and daily close above 3,246 would invalidate the bearish setup.
In that case, potential upside resistance levels are:
3,350 – First resistance
3,460 – Further upside target
Conclusion
ETHUSD remains under bearish pressure, with the 3,246 level acting as a key inflection point. As long as price remains below this level, the bias favours further downside. Traders should watch for price confirmation around that level to assess the next move.
This communication is for informational purposes only and should not be viewed as any form of recommendation as to a particular course of action or as investment advice. It is not intended as an offer or solicitation for the purchase or sale of any financial instrument or as an official confirmation of any transaction. Opinions, estimates and assumptions expressed herein are made as of the date of this communication and are subject to change without notice. This communication has been prepared based upon information, including market prices, data and other information, believed to be reliable; however, Trade Nation does not warrant its completeness or accuracy. All market prices and market data contained in or attached to this communication are indicative and subject to change without notice.

ETHUSD to 5K, then 6KMonthly is very clear directionally and I accumulated around current market price. I'm looking for an injection to come in Dec to sponsor longs with targets at 5K and 6K as the next run.

Interest Rates and Inflation in the Global Market What Is Inflation?
Inflation is the rate at which the general level of prices for goods and services rises over time. When inflation increases, each unit of currency buys fewer goods and services, reducing purchasing power.
Types of inflation
Demand-pull inflation – When demand exceeds supply (e.g., strong economy, rising consumption).
Cost-push inflation – When production costs rise (e.g., higher crude oil, raw materials, wages).
Built-in inflation – Workers demand higher wages because they expect prices to rise, leading to a wage-price spiral.
Moderate inflation is considered normal and even healthy for economic growth. Extremely high inflation erodes savings and investment confidence, while very low or negative inflation (deflation) can damage economic momentum.
What Are Interest Rates?
Interest rates represent the cost of borrowing money. Central banks such as the Federal Reserve (US), RBI (India), ECB (Europe), and others set benchmark policy rates that influence lending rates, deposit rates, loans, mortgages, and corporate borrowing.
Types of interest rates
Policy rate (Repo/interest rate by central bank)
Interbank rates (e.g., LIBOR, SOFR)
Commercial lending rates (bank loans, mortgages)
Bond yields (returns on government securities)
When interest rates rise, borrowing becomes costlier. When they fall, liquidity increases and borrowing becomes more attractive.
The Relationship Between Interest Rates and Inflation
Interest rates and inflation are closely linked by the monetary policy of central banks.
When inflation is high, central banks typically increase interest rates to slow the economy.
When inflation is low, central banks reduce interest rates to stimulate spending and investment.
This relationship is known as the interest rate–inflation trade-off.
Why central banks raise rates during high inflation
Higher interest rates reduce borrowing.
Consumers spend less; businesses delay expansion.
Demand slows → price pressure cools → inflation moderates.
Why central banks cut rates in low inflation
Cheaper loans boost economic activity.
Consumers buy more; businesses invest more.
Demand rises → inflation increases gradually to healthy levels.
How Inflation Impacts Financial Markets
1. Stock Markets
Inflation affects corporate profits, valuation multiples, and investor sentiment.
High inflation: negative or volatile for markets
Higher costs → lower margins.
Reduced consumer spending.
Higher interest rates lower PE ratios.
Uncertainty leads to volatility.
Sectors that perform better during high inflation:
Energy
Commodities
Metals
FMCG (Pricing power stocks)
Banks (during rate hikes)
Low inflation: supportive for equity markets
Stable costs create predictable earnings.
Low interest rates boost valuations (higher PE).
Liquidity flows into equities.
Sectors that perform strongly:
Tech
Real estate
Automobiles
Growth stocks
2. Bond Markets
Bond prices and interest rates have an inverse relationship.
When rates rise
Existing bonds lose value.
New bonds offer higher yields.
Long-duration bonds fall the most.
When rates fall
Bond prices rise.
Investors earn capital gains.
Borrowing increases, boosting credit growth.
Inflation reduces the real return of bonds, making inflation-indexed bonds (like India’s inflation-linked government securities) attractive.
3. Currency Markets
Inflation and interest rates heavily influence currency strength.
High interest rates → stronger currency
Because:
Higher yields attract foreign investment.
Carry trades favor high-interest-rate currencies.
High inflation → weaker currency
Because:
Purchasing power declines.
Foreign investors lose confidence.
For example:
US dollar strengthens when Fed hikes rates.
Emerging market currencies weaken when global inflation rises.
4. Commodity Markets
Inflation and interest rates influence commodities like gold, crude oil, and metals.
Inflation impact
Inflation pushes commodity prices up (raw materials cost more).
Gold rises as a hedge against inflation.
Interest rate impact
High rates strengthen USD → commodities fall.
Low rates weaken USD → commodities rise.
How Interest Rates Influence Markets
1. Equity Markets
Interest rates directly impact corporate earnings and valuations.
Rate hikes
Increase borrowing costs → lower profits.
Reduce liquidity → markets correct.
PE multiples shrink → growth stocks fall.
Sectors that benefit:
Banking
Insurance
Sectors that suffer:
IT/Tech
Real estate
Consumer durables
Rate cuts
Cheaper loans → higher demand.
Economic activity increases.
Stock markets rally.
Growth stocks and sectors like tech, auto, and real estate benefit the most.
2. Real Estate Markets
High interest rates make home loans expensive → real estate slows.
Low rates boost property demand.
Real estate cycles closely follow monetary cycles.
3. Banking and Financial Sector
Banks gain when rates rise gradually, because:
Net interest margins (NIMs) increase.
Deposit rates lag lending rates.
But rapid rate hikes can hurt banks if loan defaults increase.
4. Consumer Behavior
Interest rates influence how households spend money.
High interest rates
People save more, spend less.
Home, auto, and consumer loans drop.
Discretionary consumption declines.
Low interest rates
Consumers borrow more.
Spending rises.
Economic growth increases.
Central Bank Policies and Their Role
Central banks use monetary tools to balance inflation and economic growth:
Key tools
Policy rates (Repo, Federal Funds Rate)
Open market operations (buying/selling bonds)
Cash reserve ratio (CRR)
Quantitative easing/tightening
Central banks must maintain:
Price stability
Economic growth
Currency stability
Mistimed rate decisions can trigger recessions or hyperinflation.
Global Impact of Inflation and Interest Rate Cycles
1. Emerging Markets
Countries like India, Brazil, or Indonesia are sensitive to:
US interest rate cycles
Dollar strength
Commodity prices
When the Fed hikes rates:
Foreign money exits emerging markets.
Stock markets correct.
Currencies weaken.
2. Developed Markets
Low inflation and low rates often lead to:
High equity valuations
Growth in tech and innovation investments
High inflation and high rates often trigger:
Bond market stress
Housing market corrections
Why Tracking These Indicators Matters
For investors and traders, monitoring inflation and interest rates helps in:
Identifying market cycles
Building sector-focused strategies
Adjusting risk in portfolios
Understanding currency and commodity trends
Making informed decisions in equity, debt, and forex
Conclusion
Interest rates and inflation form the backbone of global market dynamics. Their relationship influences everything from stock prices and bond yields to consumer spending and currency strategies. When inflation rises, central banks tighten rates, slowing economic activity but stabilizing prices. When inflation falls, rate cuts stimulate growth and liquidity. For investors, understanding these movements is crucial for timing market cycles, selecting the right sectors, and reducing risk. Ultimately, mastering the interplay between inflation and interest rates leads to smarter investment decisions and long-term wealth creation.

ETH Late Stage Bull Cycle Look at ethbtc reversal and breakout
Indicating ETH going to outperfrom BTC next 5 months
Which by all it means, late stage bull which will lead us to temporary bear market for BTC
ETHBTC 0.05
BTC 116K
ETH 5.8K