EURGBPEURGBP has been on a downward trend for some days, I expect the downward movement to continue, from currently position, I am expecting EURGBP to move downward and make a new lower low.
EURGBP trade ideas

EURGBP LONG SETUP!It is crucial to note that FX:EURGBP is currently at a robust support level and forming a bullish divergence on the 4-hour time frame. A pullback is expected from this point, as liquidity has recently surged from the lows. Therefore, it is advisable to enter a long trade with a stop loss at the recent low and take profit at the recent high, targeting a 1:2 risk-reward ratio.

EUR/GBP there, two different bearish formations were present. There was a bear flag as taken from a bullish channel that arrived after a test of the .8500 handle; and bigger picture, there was a descending triangle present with that .8500 level helping to set horizontal support.
The other side of the matter, however, was a relative dearth of volatility so far in 2024 trade as the pair had spent much of the year within an approximate 120 pip range. But, given the fundamental backdrop where the ECB seems closer to cuts than the BoE, there’s an argument for continued divergence between the two economies.
At this point the .8500 handle has come back into play and there’s potential for the descending triangle to fill-in.

✅EUR_GBP RISKY LONG🚀
✅EUR_GBP is going down now
But a strong support level is ahead at 0.8512
Thus I am expecting a rebound
And a move up towards the target at 0.8494
LONG🚀
✅Like and subscribe to never miss a new idea!✅

EURGBP: Long Trade with Entry/SL/TP
EURGBP
- Classic bullish formation
- Our team expects growth
SUGGESTED TRADE:
Swing Trade
Buy EURGBP
Entry Level - 0.8498
Sl - 0.8475
Tp - 0.8543
Our Risk - 1%
Start protection of your profits from lower levels
❤️ Please, support our work with like & comment! ❤️

EURGBPEURGBP has just too strong support with break out of falling trend line and bullish divergence
can buy at current price with stop loss 0.8499
Risk Reward 1:1 0.8537
Risk Reward 1:2 0.8556
Risk Reward 1:3 0.8575
Risk Reward 1:4 0.8594
Risk Reward 1:5 0.8613
FUNDAMENTAL ; long
SENTIMENTAL : long
TRADE AT YOUR OWN RISK

check the trend It is expected that a trend change will be formed in the current support range and the beginning of the corrective trend will be formed up to the specified resistance range.
Consolidation below the support area will create a continuation of the downtrend

EURGBP Harmonic Pattern Long Trade EURGBP Bullish IdeaEURGBP Harmonic Pattern Long Trade EURGBP Bullish Idea
Instant Entry or at Breakout of B point
and new Higher High.

EURGBP FORREXThe Chart was printing a bearish Trend but their was divergence so after the divergence the trend become bullish as it already made HH and HL.
The Entry will be instant 0.85183 and the stop loss will be 0.85030

EUR/GBPA bullish flag is a technical analysis pattern that indicates a potential continuation of an existing upward trend. It resembles a flag on a pole and is used by traders to identify short-term consolidation periods followed by a breakout in the direction of the prevailing trend. Here's an overview of the bullish flag pattern:
Structure of a Bullish Flag
1. **Flagpole**: This is the initial sharp upward movement in price, representing a strong bullish trend.
2. **Flag**: After the sharp rise, the price consolidates, moving in a small, downward-sloping or horizontal channel. This consolidation forms the flag part of the pattern.
3. **Breakout**: After the consolidation phase, the price breaks out of the flag pattern, continuing the upward trend.
Identifying a Bullish Flag
1. **Strong Uptrend**: Look for a strong upward movement (flagpole) in the price of the asset.
2. **Consolidation**: Identify a consolidation phase where the price moves sideways or slightly downward in a parallel channel (flag).
3. **Volume**: During the flag formation, the volume typically decreases, indicating a lack of strong selling pressure.
4. **Breakout**: A breakout from the flag pattern occurs with an increase in volume, resuming the upward trend.
Example
1. **Flagpole**: The price of a stock rises from $50 to $70 rapidly.
2. **Flag**: The price consolidates between $65 and $70, forming a downward-sloping channel.
3. **Breakout**: The price breaks out above $70 with increased volume, continuing the uptrend.
Trading the Bullish Flag
1. **Entry Point**: Enter the trade when the price breaks above the upper trendline of the flag with increased volume.
2. **Stop-Loss**: Place a stop-loss order below the lowest point of the flag to manage risk.
3. **Target Price**: The target price is usually estimated by adding the length of the flagpole to the breakout point.
Example Calculation
- **Flagpole Length**: $70 - $50 = $20.
- **Breakout Point**: $70.
- **Target Price**: $70 + $20 = $90.
Benefits and Risks
**Benefits**:
- **Clear Pattern**: The bullish flag is relatively easy to identify and trade.
- **Continuation Signal**: It signals the continuation of an existing uptrend, providing traders with a clear direction.
**Risks**:
- **False Breakouts**: There is a risk of false breakouts, where the price breaks out of the flag but then reverses.
- **Market Conditions**: The pattern is more reliable in strong trending markets and less effective in choppy or sideways markets.
Conclusion
The bullish flag pattern is a powerful tool for traders looking to capitalize on the continuation of an uptrend. By identifying the initial strong move, the consolidation phase, and the breakout, traders can set up trades with clear entry and exit points, effectively managing risk and potential rewards.

EURGBP: Wait for Confirmation Before Bullish EntryThe EURGBP is testing a critical support level at 0.85 on the daily chart. While a bullish rally seems likely, cautious entry is advised to avoid potential retracements aimed at trapping retail traders.
Key Points:
1. Price dipped close to the 0.85 support zone.
2. Upward move possible, but confirmation is crucial.
3. Wait for a daily candle close above 0.8530 before entering a long position.
4. This will provide a stronger signal of a bullish breakout.
Remember: The market can be unpredictable. Always practice proper risk management and consider using stop-loss orders.

EURGBPhello everyone, this is based on day tf, the price has reached strong support area, the price may get bullish and may breakout of 200ma.. currently the price did recover last Thursday after PMI news, while GBP dip with poor retail news.. some minor news for euro this week.. may recover more.. price dropped from 0.8532 to 0.8515 based on 15min tf ... price need to make new high above 0.8532 to show Euro in strength... 0.8532 is all time strong resistance area that need to break for price to remain bullish...

Looking for clues on EURGBP (lower timeframe)As markets re-open, we track price with the intention of finding out where it will head next on this pair.
The monthly timeframe shows ranging in a defined price region over a prolonged period (since November 2023). The 4h timeframe show bearish activity where we have noted a retest of a high at the 0.85323 price point (shown on the 15m timeframe as the current SWING HIGH.
Price is currently boxed in a small but very powerful range. In the short-term, we expect a taking out of highs and lows (manipulation) before the establishment of any real structure to trade. At this time, price is in the discount region, so on this lower timeframe, we would only be interested in going Long. For now, we sit on our hands and watch things play out.

EURGBP LONG TERM Buying TRADING IDEAHello Traders
In This Chart EURGBP HOURLY Forex Forecast By FOREX PLANET
today EURGBP analysis 👆
🟢This Chart includes_ (EURGBP market update)
🟢What is The Next Opportunity on EURGBP Market
🟢how to Enter to the Valid Entry With Assurance Profit
This CHART is For Trader's that Want to Improve Their Technical Analysis Skills and Their Trading By Understanding How To Analyze The Market Using Multiple Timeframes and Understanding The Bigger Picture on the Chart

Swing Sniper Signals Long for $EURGBPLong signal printed. Coming off bottom of bearish channel. Should be long @ market open up to 0.8590 (near top of channel and major supply zone).

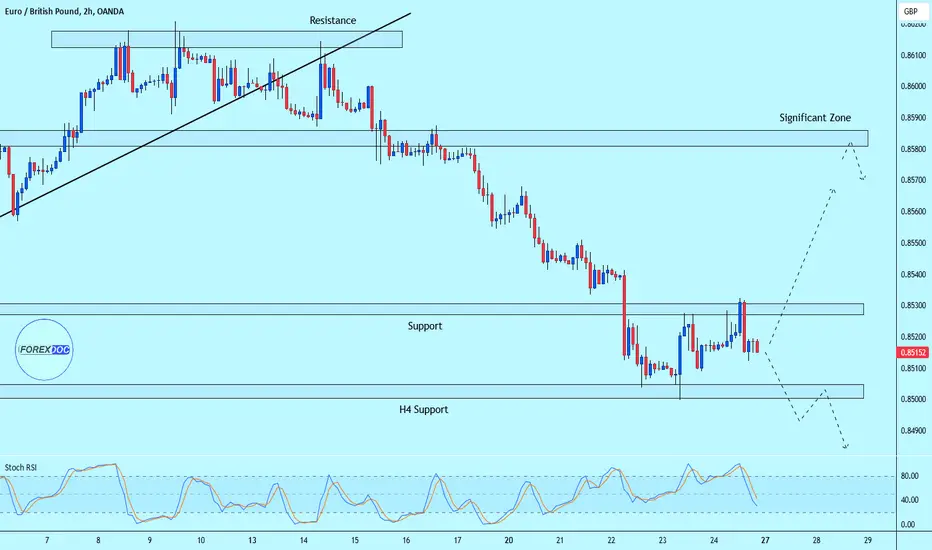
Very Strong Downtrend 🔴EUR/GBP H2
We can see very strong downtrend here. Price reacted to 0.85000 H4 support zone, but retested 0.85300 zone. It is possible to see bearish continuation, but if price breaks 0.85300 zone, I will look to buy.
[EURGBP] RED FLAG Down Trend [Date 27-31/5/24]Date 27-31/5/24
Mouth Weekly Daily Position
Bias Short
Strong Supply Short
Target 0.76262
Weekly Daily Bias Short
1st Target 0.83262
H4 Follow Trend
0.85460 Zone
Now
Miss a Train


EURGBP BULLISH - May 24📢 Signal: BUY EURGBP 📈
Entry Point: 0.85221 🔍
TP1: 0.85231 🎯 (10 pip TP)
TP2: 0.85241 🎯 (20 pip TP)
SL: 0.85211 ⛔️ (10 pip SL)
Ensure proper risk management when following signals! 💡
@Mr_Bombastic_Signal

EURGBPHello traders
EURGBP stays strong zone of support that means buyers are now ready to resist sellers on pressure and overrule the market, so as retail traders we look chances of entries so its high probability to buy. if you need more of my setups don't miss it to follow me.

check the trend An uptrend is expected to form up to the specified resistance levels. Then, according to the behavior of the price in this range, the continuation of the movement process will proceed according to the specified paths

EURGBPLooking for a buy trade on EG.
Reason to buy:
1. H1 chart is in oversell area.
2. possible to make inverted Head and Shoulder pattern in 1H chart.
Use proper risk management.
Thank you

