EURUSD WILL GO HIGHER BUYTP-1-------15Pip
TP-2-------35Pip
TP-3-------Full TP
Manage SL during news time, intraday trade tp and sl mentioned not a financial advice
EURUSD_TOD trade ideas

Trade idea - EURUSD Short4H
Corrective approach towards entry zone.
= Sell limit
Bearish W pattern also there as extra evidence.
1% risk.

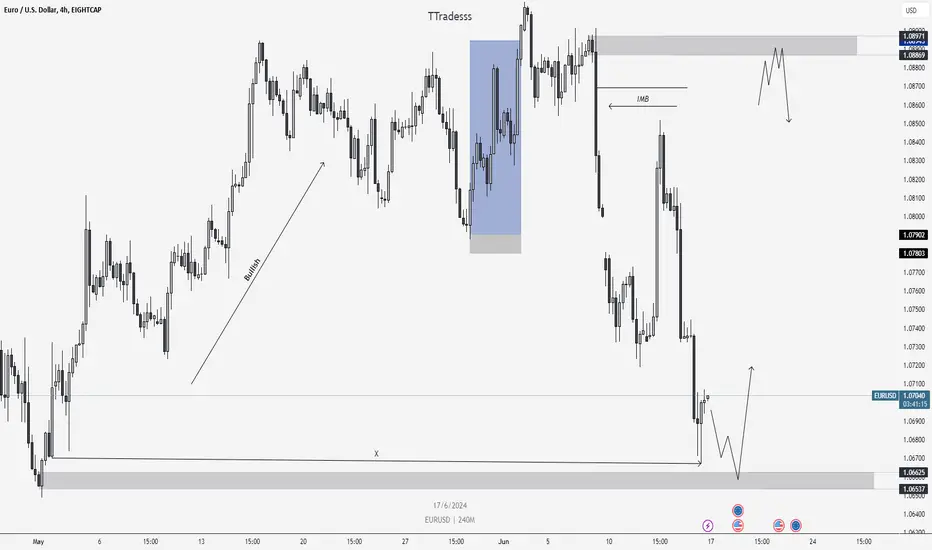
CHART BREAKDOWN EURUSD: Key Levels, Targets and Thoughts!Brief Description🖊️:
The chart provides insights into critical market levels, emphasizing an essential demand zone (low-risk buy zone) spanning from 1.0653 to 1.0662. Additionally, a low-risk sell zone between 1.0887 to 1.0897, respectively, is highlighted.
Things I Have Seen👀:
Important Supply Zone🟢: Identified between 1.0887 to 1.0897, serving as a low-risk sell.
Important Demand Zone🟢: Identified between 1.0653 to 1.0662, serving as a low-risk buy.
Bullish Targets📈:
1.0720: Possible retracement area.
1.0730: Possible retracement area.
1.0760: Possible retracement area.
1.0810: Possible retracement area.
1.0840: Possible retracement area.
1.0887: Significant supply zone.
1.0910: Liquidity area.
Bearish Targets📉:
1.0840: Possible retracement area.
1.0810: Possible retracement area.
1.0760: Possible retracement area.
1.0730: Possible retracement area.
1.0720: Possible retracement area.
1.0662: Essential Demand Zone
Ultimate Target: 1.0650- Laying Low Liquidity
What's Important Now❗
Currently, the crucial approach is to wait and observe the price action at this level. We need to assess how the market reacts before considering any decisive moves. Stay observant and responsive to real-time developments in the market.

EURUSD: Still Looks Bearish! Here is Why:The EURUSD is currently trading within a significant downward channel, with the price likely to be influenced by a resistance cluster formed by the channel's upper boundary and a horizontal supply zone.
I anticipate a bearish movement to occur from the highlighted red area.
However, I would advise considering buying EURUSD only after it breaks out of that zone.

EURUSD: Bullish Forecast & Bullish Scenario
The recent price action on the EURUSD pair was keeping me on the fence, however, my bias is slowly but surely changing into the bullish one and I think we will see the price go up.
❤️ Please, support our work with like & comment! ❤️

EUR/USD Shorts from 1.07400My bias is similar to GU, given the significant bearish pressure we've seen. I aim to continue this bearish trend. Currently, I am waiting for a pullback into a supply level for price to distribute and maintain its downward direction.
I will look for sell opportunities at the 10-hour supply zone. If the price doesn't react there, I expect a stronger response from the 4-hourly supply zone, which is at a more premium price. From there, I plan to sell back down, targeting the liquidity below.
Confluences for EU Sells are as follows:
- Lots of liquidity below that needs to get taken as well as imbalances that need to get filled.
- DXY is also looking bullish which aligns with this idea as well.
- Price has left a clean level of supply that has been unmitigated.
- Price is currently in a downtrend so this is a pro-trend idea.
- Higher time frame and candle stick anatomy also show bearish
P.S. If the price drops a bit more, I will consider taking buys from the 4-hour demand zone, as it is valid and at a good price point. However, if this zone breaks, it will further confirm my bearish bias.

EUR and the month of JULY in the past 50 years! Check it out!We just entered a new month, and not just an ordinary month -- It's JULY!
And what's special about it? -- and its connection to EUR?
Based on 50 year chart history, JULY is EUR's favorite month to 'ascend' so to speak.
JULY seems to play an important role for the pair's price behavior. A lot of times, what comes after a correction -- is an upside reversal that falls most of the time on the month of JULY. This has happened multiple times in the past. It maybe a short term upside season, a major bullish one or an extended long continuation -- but it seems to bounce during those months.
We just concluded June, and we have entered the 'divine' month for EUR which is JULY. Based on the present price level, we have created a new base to ascend. Last friday's closing (June ending) was an indication of things to come. Going forward as we enter this month, with the last closing price -- it looks like we are heading towards the "expected" direction based on historical movements.
Of course this is not indicative of the pairs future price, but we can certainly be guided.
Just something to ponder about and an interesting way of looking at how fascinating and dynamic price behavior could be.'
The chart above is a HEXAMONTHLY (6-monthly) CHART
Spotted 1.09
TAYOR.
Safeguard capital always

Expect sell on euAm expecting price to get to the IRL of the BRP. Then we target sells to the ssl @1.06495

EURUSD: 2 Bearish Confirmations 🇪🇺🇺🇸
I see 2 strong bearish signals on EURUSD.
After a formation of a strong bearish impulse,
the pair started to steadily recover within a bearish flag pattern on a 4H.
The price also formed the inside bar formation within the boundaries of the flag.
Today, both the support of the flag and the range of the mother's bar were broken.
It is a very strong technical confirmations.
I think that the market may drop to 1.069
❤️Please, support my work with like, thank you!❤️

EUR/USDTechnical Analysis: EUR/USD
The risk of this trade is low because it is in the direction of the main market trend.
Entry prices:
1.07344
Profit limit:
1.06552
1.06107
Loss limit:
1.07747
Before using this signal and analysis, be sure to check your analysis chart.
Attention!!!
In these analyses, only technical analysis is considered
Therefore, be sure to check the initial news before entering.
Attention!!!
100% does not exist in financial markets
So don't enter this signal hoping for a definite profit.

BUY EURUSDToday we are monitoring EURUSD for bullish pullback. Entry at 1.0732 target 1.0807 and stop below 1.0708. Use proper risk management.

Bearish drop?EUR/USD is rising towards a resistance level which is a pullback resistance that is slightly below the 38.2% Fibonacci retracement and could reverse from this level to our take profit.
Entry: 1.07268
Why we like it:
There is a pullback resistance level that is slightly below the 38.2% Fibonacci retracement.
Stop loss: 1.07750
Why we like it:
There is a pullback resistance level which aligns with the 61.8% Fibonacci retracement.
Take profit: 1.06504
Why we like it:
There is a pullback support level.
Please be advised that the information presented on TradingView is provided to Vantage (‘Vantage Global Limited’, ‘we’) by a third-party provider (‘Everest Fortune Group’). Please be reminded that you are solely responsible for the trading decisions on your account. There is a very high degree of risk involved in trading. Any information and/or content is intended entirely for research, educational and informational purposes only and does not constitute investment or consultation advice or investment strategy. The information is not tailored to the investment needs of any specific person and therefore does not involve a consideration of any of the investment objectives, financial situation or needs of any viewer that may receive it. Kindly also note that past performance is not a reliable indicator of future results. Actual results may differ materially from those anticipated in forward-looking or past performance statements. We assume no liability as to the accuracy or completeness of any of the information and/or content provided herein and the Company cannot be held responsible for any omission, mistake nor for any loss or damage including without limitation to any loss of profit which may arise from reliance on any information supplied by Everest Fortune Group.

EURUSD analysis week 27📌EUR/USD continued to slide to Friday's lows, falling to 1.0670 before recovering to 1.0700 during the US market session. Political pressure is weighing on the Euro after a major change in European voter sentiment.
📌On the US side, increasingly negative data is raising concerns about a possible recession, fueled by the results of the University of Michigan (UoM) consumer sentiment survey. worse than expected.
📌The currency pair is trading far away from the EMA 34 and EMA 89, showing that there has been instability in the pair over the past week. The downtrend is clearly established as the key support zone of 1,073 was broken and created a bearish Dow pattern. The pair's narrow trading range was formed at 1,070 and 1,076. When the market fluctuates strongly due to news of important resistance and support areas next week, investors can pay attention to the port areas of 1,061 and 1,080.
Trading signals
BUY EURUSD zone 1.06200-1.06000 SL 1.065800
SELL EURUSD zone 1.08000-1.08200 SL 1.08400
Support: 1.062 - 1.070
Resistance: 1.076 - 1.080

EURUSD / Bullish Trend Above 1.0740 with Key Levels to WatchEUR/USD Outlook
Current Outlook:
The price is expected to trade in the bullish zone, having reversed and stabilized above the pivot zone.
Bearish Scenario:
The price would need to reverse and stabilize below 1.0707 to initiate a bearish trend.
Bullish Scenario:
As long as the price remains above 1.0740, the bullish trend is expected to continue, targeting 1.0796.
Key Levels:
- Pivot Line: 1.0740
- Support Levels: 1.0680, 1.0620, 1.0505
- Resistance Levels: 1.0796, 1.0850, 1.0915
Expected Trading Range:
The price is anticipated to move between the resistance at 1.0796 and the support at 1.0707.
In summary, maintaining a position above 1.0740 supports a bullish outlook, aiming for higher resistance levels. Conversely, trading below 1.0707 indicates a bearish trend with potential support targets.

EUR/USD Gains Momentum Ahead of US Core Retail Sales Data ReleasThe EUR/USD pair is trading higher on Tuesday, following a pullback to the support level at 1.06690, which coincides with the 78.6% Fibonacci retracement from the previous swing low. This support area has provided a strong foundation for the pair, allowing it to gain upward momentum.
Traders are closely monitoring the upcoming US Retail Sales data, particularly the Core Retail Sales m/m figures, which are expected to be a significant catalyst for further movement in the EUR/USD pair. Positive data could push the pair even higher, as it would indicate stronger consumer spending in the US, potentially leading to a stronger US Dollar. However, any signs of weaker data could bolster the Euro further, as traders anticipate a less aggressive stance from the Federal Reserve.
Adding to the bullish outlook, there is a noticeable divergence on the H4 timeframe's stochastic indicator. Divergence occurs when the price movement of the currency pair contrasts with the indicator, often signaling a potential reversal or strengthening of the current trend. In this case, the stochastic divergence suggests that the upward movement of the EUR/USD pair could gain more traction.
Institutional traders also seem to be favoring the Euro over the US Dollar. Reports indicate a significant increase in long positions on the Euro, reflecting a broader sentiment shift among large market participants. This institutional support adds further credibility to the potential for continued upward movement in the EUR/USD pair.
In summary, the EUR/USD pair is showing promising signs of a bullish continuation after rebounding from a key support level and the 78.6% Fibonacci retracement. With the upcoming US Retail Sales data and technical indicators aligning in favor of the Euro, traders have a reason to anticipate further gains. The increased long positions by institutional traders further reinforce this positive outlook, suggesting that the pair could see sustained upward momentum in the near term.

EURUSD Long/BuyEURUSD looks like it can go long from here, last two supports have respected the trend and as well the fact being that EURUSD looks like its third wave back up for a retrace after a heavy drop. I have placed the entry, TP, and SL for the trade. Please message me or let me know any questions you may have in regard to this trade or in general about us and our page! Please make sure to follow our page for more daily signals!

EURUSD EFFORTS TO RECOVER FROM LOSS...Dear Traders,As you know after wednesday EUR/USD retreated and recorded large dump on thersday
Over All EURUSD Outlook from the market remains bearish as the pair continues to trade in a tightening wedge pattren
Bht we Accepts That in short term,Eurusd Will Still Recieve Good Support with aim Of Reaching To the resistance level.
Resistance -1.0770-10775
Will Fly Befor Falling Deeeper According to the Outlook.

Its overall bearish but long is also possible Im bearish but we can get the long trade also as explained in the video.
Always follow these rules
- Accumulation / Manipulation / Distribution
- No liquidity raid = No trade
- Never buy high and never sell low
“Adapt what is useful, reject what is useless, and add what is specifically your own.”
Dave FX Hunter ⚔
Follow me for daily updates.

EURUSD:: IntradayBy taking a deeper look at Daily chart we could easily see a bearish move!
Latest reaction was to top of the channel an we are going to reach to bottom of the channel. However, We see the RSI is forming a trend line which seems hard to be broken down. I think we could see a reversal to MA of RSI. So we might have one or two range days. Therefore we are both ready for Bearish and range days.
By taking a look to 1h chart we could see that a great zone to short the pair is available!
However by breaking the 1.0770 we could consider the trend bullish.
What is obvious in the main chart is that today Fibonacci R1 is in coincide with yesterday Pivot and these two are perfectly in our zone!
I'm waiting to sell from there! the channel in 15m chart could be used as liquidity hunt! These are important levels of today you can search for more reasons or places to short the pair

EUR USD PRICE - GET READY TO FLY UP SIDE HERE we can see that price moving in a downward direction, waiting for breakout, make a long entry after retest.. follow for more live updates...

EUR/USDTechnical Analysis: EUR/USD
The second scenario is to break the zone with a powerful candle in the range of 1.07882.
Entry prices:
1.08557
1.07994
Profit limit:
1.06920
Loss limit:
1.09238
1.08400
Before using this signal and analysis, be sure to check your analysis chart.
Attention!!!
In these analyses, only technical analysis is considered
So be sure to check the basic news before entering.
Attention!!!
100% does not exist in financial markets
So don't enter this signal hoping for a definite profit.

CHART BREAKDOWN EURUSD: Key Levels, Targets and Thoughts!Brief Description🖊️:
The chart provides insights into critical market levels, emphasizing an essential demand zone (low-risk buy zone) spanning from 1.0653 to 1.0662. Additionally, a low-risk sell zone between 1.0887 to 1.0897, respectively, is highlighted.
Things I Have Seen👀:
Important Supply Zone🟢: Identified between 1.0887 to 1.0897, serving as a low-risk sell.
Important Demand Zone🟢: Identified between 1.0653 to 1.0662, serving as a low-risk buy.
Bullish Targets📈:
1.0720: Possible retracement area.
1.0730: Possible retracement area.
1.0760: Possible retracement area.
1.0810: Possible retracement area.
1.0840: Possible retracement area.
1.0887: Significant supply zone.
1.0910: Liquidity area.
Bearish Targets📉:
1.0840: Possible retracement area.
1.0810: Possible retracement area.
1.0760: Possible retracement area.
1.0730: Possible retracement area.
1.0720: Possible retracement area.
1.0662: Essential Demand Zone
Ultimate Target: 1.0650- Laying Low Liquidity
What's Important Now❗
Currently, the crucial approach is to wait and observe the price action at this level. We need to assess how the market reacts before considering any decisive moves. Stay observant and responsive to real-time developments in the market.
EURUSD: still no cutThe major event during the previous week was the FOMC meeting, where its members were deciding on the course of the US reference interest rates. The rates were left unchanged, which was widely expected by market participants, but what the market could not anticipate is that the Fed cut their interest rate projections till the end of this year, and from initially expected three rate cuts, the Fed is now projecting only one later this year. This information was crucial for the markets to start their re-positioning, which implied extreme volatility in prices of equities, Treasury bonds, and gold on Wednesday, while the US Dollar also had its strong shifts. Before the FOMC meeting, the latest US inflation data was published. Inflation rate in May was standing at the level of 3.3% y/y, which was lower from the market forecast of 3.4%. Core inflation rate also slowed down to the level of 3.4% y/y, again lower from market forecast of 3.5%. As for other US macro data released during the week, Producers Price Index was down by -0.2% m/m in May, lower from forecasted +0.1%. Initial Jobless Claims in June were standing at 242K, missing market estimate of 225K. Michigan Consumer Sentiment preliminary for June was 65.6, much lower from the market estimate at 72.
Inflation rate in Germany final for May, was standing at 2.4% y/y, without a change from a previous post. There have not been further significant macro data published for the Euro Zone and Germany, as its strongest economy.
Fed-induced volatility has been dominant on the eurusd market during the previous week. The currency pair had its own strong swifts toward both sides, as the market initially was not sure which side to trade. In this sense, the range in which eurusd was traded was wide between levels of 1.085 down to 1.067. Still, the currency pair is ending the week at the level of 1.07. The RSI is on its clear path toward the oversold side, however, it will need some more time until the clear oversold momentum is reached, considering that it is currently moving around the level of 38. Moving averages of 50 and 200 days continue to move as two parallel lines still, without an indication of a potential cross.
Two weeks ago charts were clearly indicating that the next target of eurusd might be long term support at 1.067. Although it should have happened within a longer period of time, still, the market decided to test this level during the previous week. However, it was clear that this support will not be reached until 1.07 is clearly tested, so it could be expected that the market will spend a week ahead testing these levels. At this moment, there is an extremely low probability that 1.08 could be reached for one more time. Charts are indicating that the week ahead might be a bearish one for the currency pair.
Important news to watch during the week ahead are:
Euro: Core Inflation Rate final for May in Euro Zone, ZEW Economic Sentiment Index for June for the Euro Zone and Germany, HCOB Manufacturing PMI flash for June for Germany,
USD: Retail Sales in May, Building Permits preliminary for May
