EURNOK - Head & Shoulders (NOT THE SHAMPOO)I'm a big fan of price formations on larger time frames. The EURNOK is looking really nice for a 5,000-6,000 pip H&S. I continue to watch the price movements and will look to trade a re-test of the 9.5000-9.6000 right shoulder area (that's to test the waters and perhaps land a great entry). The real confirmation is price closing below 9.2000. You can see the symmetry and H&S projection areas. Let's get some pips. THIS TRADE AND OTHERS IS DISCUSSED AT DAYTRADERS FX and a video walkthrough can be found in the DAYTRADERS FX ON-DEMAND LIBRARY
Lovely pattern, expecting some solid profits.
EUXNOK trade ideas

EUR/NOK bears seem to be back in business after BrexitEUR/NOK bears seem to be back in business after banking on Brexit results, shooting star plummets prices, more bearish effects on cards:
After two days of crazily spiked bulls seems to have given up the momentum from the last couple of trading sessions.
On intraday charts, the pair has formed back to back shooting star and hanging man patterns at 9.4498 and 9.4458 levels respectively to evidence more bearish collapse in intraday trend.
Most notably, the current prices have again gone below DMAs
Shooting star occurred at peaks of rallies, (at 9.4443) (see monthly charts).
This bearish pattern with huge volumes which means weakness could be measured at this juncture.
While at the same juncture RSI touched overbought region and began converging to the price declines.
Stochastic has been indecisive at this stage but with slightly bearish favour.
Same is the case with MACD which is quite indecisive but shows a little weakness to prevail further.
Monthly prices are hanging 7EMA, any push below would take it to 9.15 levels for sure.

#EURNOK: Opportunity To Short!The pair was rangebound in a symmetrical triangle structure now it looks like the pair has broken out to downside so it is worth keeping an eye on this one for a trade set up
For more information in joining my professional signals group or professional online trading tuition, Message me directly on Trading view or email me with the email address on my Trading view profile page
Twitter: Tomkillick1
Email: T.killick182@gmail.com
Skype: Tom.killick182

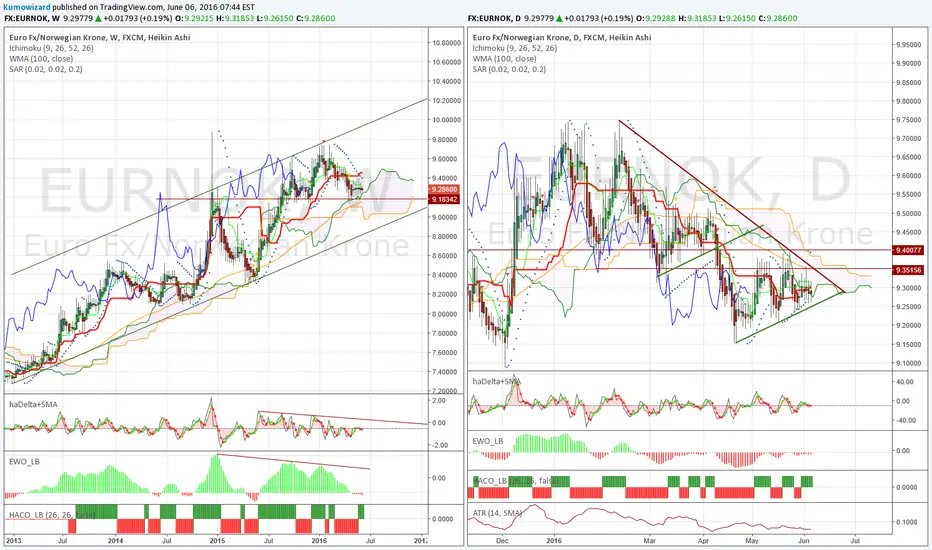
For how long can NOK be this neutral?e room within the daily triangle is getting extremely tight. That means quite soon we'll see a breakout. Let's see the -bearish and bullish arguments.
Weekly:
- Ichimoku is neutral, with some bearish bias: a thick Kumo cloud shades price ahead. Price is below Kijun and Tenkan/Kijun has been weak bearish for a while.
- Heikin-Ashi is absolutely neutral: we had 5 doji weekly candles in a row. haDelta/SMA is stuck ard zero line.
- Lower key zone is 9,16-9,22 (horizontal line, 100WMA and Senkou B), upper key level is 9,40-9,42 (Kijun)
- EWO has seom bearish bias
- In case price can't break bck above 9,42, we may have a H&S like pattern development in progress. Obviously this idea
would be valid only with a brek below the potential neckline 9,15. Below that we still have 8,90-9,00 resistance the major trendline to fight with.
Daily:
- Ichimoku setup is neutral with bearish bias. We also have a medium strong bearish Tenkan/Kijun cross!
- Price is stuck in a triangle. The pattern is pretty much similar to the one we've seen in March-April.
First key is 9,25! If price breaks below the bullish trendline, we can have a leg down to 9,10-15
Upper key levels are: 9,35 / 9,40
- Heikin-Ashi is neutral
- EWO has bearish bias
I prefer to hold small short, with max stop at 9,42.
Eurnok Amazing Short BabyLooking good right now as breaking the lower Trend line of symetrical triangle
Reasons to short
Symetrical triangle breakout
About to reverse to downward trend
volume is on fire
Financial institutions are willing to sell
Similar Eur pairs are moving down and forming same sell patterns
1 By 4 Risk to Reward Ratio
Upper Trendline Rejection

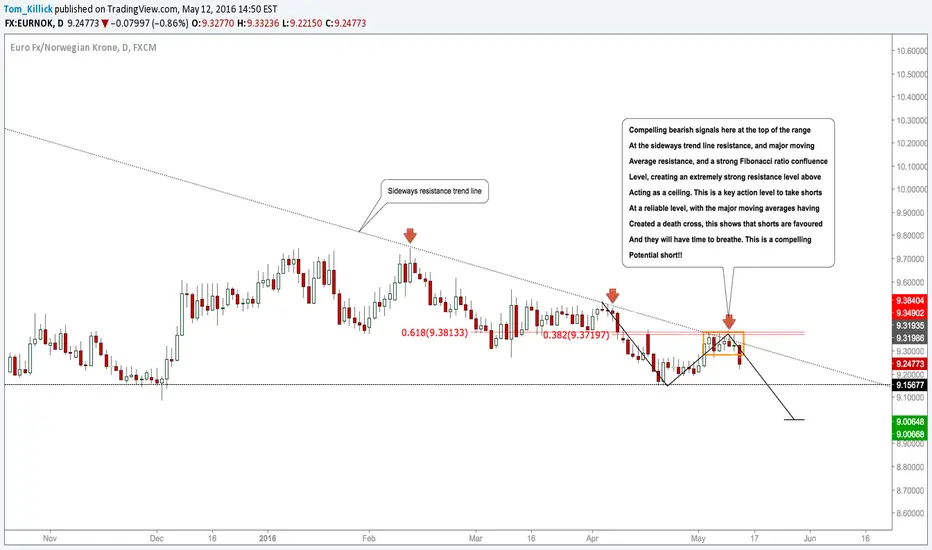
#EURNOK: Potential Action Level Found, Shorts To Be Seen! #ForexTraders,
UPDATE: Seen some nice downside since I last posted (see related ideas)
Fantastic potential short here. We have an extremely strong resistance ceiling on price right where we are now, and am expecting a compelling upside move from here. Looks very, very compelling.
---Interested in joining my professional signals group, or receiving my professional online trading tuition? Message me here on Trading view or email me with the email address on my Trading view profile page---
Best regards,
Tom

#EURNOK: Potential Action Level Found, Shorts To Be Seen! #ForexTraders,
UPDATE: We are moving well after my previous idea on this pair (See related ideas) Seeing good downside now. Fantastic potential short here. We have an extremely strong resistance ceiling on price right where we are now, and am expecting a compelling upside move from here. Looks very, very compelling.
---Interested in joining my professional signals group, or receiving my professional online trading tuition? Message me here on Trading view or email me with the email address on my Trading view profile page---
Best regards,
Tom
#EURNOK: Potential Action Level Found, Shorts To Be Seen! #ForexTraders,
Fantastic potential short here. We have an extremely strong resistance ceiling on price right where we are now, and am expecting a compelling upside move from here. Looks very, very compelling.
---Interested in joining my professional signals group, or receiving my professional online trading tuition? Message me here on Trading view or email me with the email address on my Trading view profile page---
Best regards,
Tom


Hold short, trail stop, approaching first tgtPrice is below Kijun Sen on both weekly and daily time frames. All indicators are healthy bearish on daily.
Heikin-Ashi price action is firm bearish with quite a good momentum.
Hold short until further signal. Initial bearish px tgt is getting close at 9,05+. There you can reduce and take profit on half of position.
Trail stop down to 9,39.
TP on half of shorts. Look for sell signal at 9,38-9,40As goes the Oil.... goes the NOK (more or less).
- Daily trend is bearish, and Weekly HA structure also suggests the pair has chance to continue lower towards 9,03-9,09.
- However short term I see wave exhaustion signal on daily: haDelta/SMA3 already signalled yesterday minor momentum drop. Today candle confirms start of consolidation/pull back above 9,25 resistance. Candle has both upper and lower wicks, haDelta moved more up.
- I recommend to take profit on half of short positions. Doha w/e, and as I wrote yesterday, WTI and Brent oil started a pull back too.
- Bearish support is 9,38-9,41 area, looking to re-sell there.


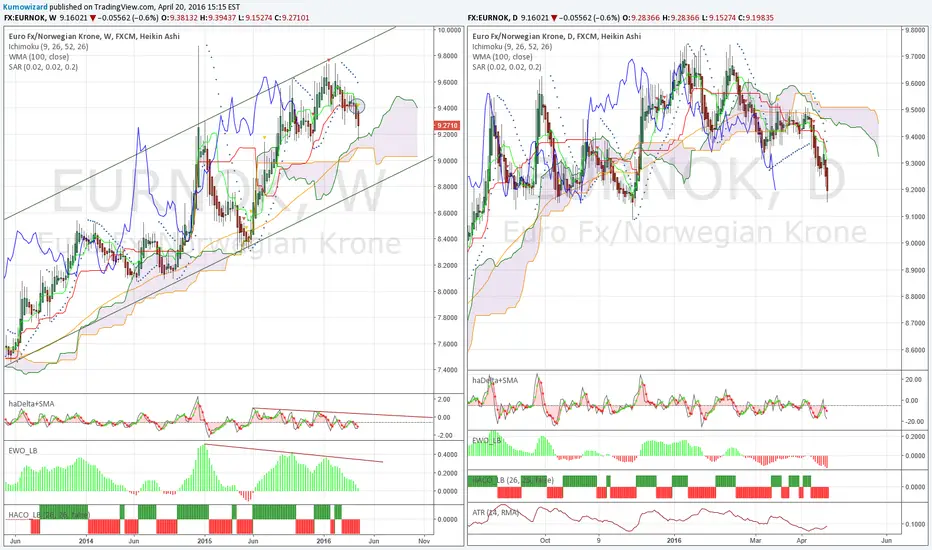
Sell moreThose who follow me on Twitter, already saw a similar chart from me about EURNOK. Now I add the weekly too, plus I'll have some more notes.
Weekly:
- The big trend is bullish, but we may experience further counter trend wave towards stronger supports
- Ichimoku picture is bullish... or is it turning neutral? It will be decided if we finally see a decisive candle close below Kijun.
- Stronger supports below Kijun are: 100WMA and Senkou B (Kumo bottom) ard 9,00-9,05 and the major trendline ard 8,80+
- Heikin-Ashi still showed undecision last week as candle had both upper and lower wick and a very small body, but price action was bearish on friday, which ended in a red body finally. Price has not managed to move back above Tenkan Sen (9 weeks avg) for 4 weeks, however still could not close below Kijun either.
haDelta/SMA3 crosses down at zero, this suggests bears may get stronger momentum.
Note: bearish divergences are always nice to realise and examine, but as you can see in both haDelta and EWO, divergences can develop and exist for extremely long time! Divergences alone can not be traded!
Daily:
- As it often happens, the initial bearish Kumo break did not have an immediate follow through at beginning of March. Bulls tried everything to push back price above 100WMA and 9,50-9,51 key supp/res lvl, but they failed 14-16 times!!! (that is like trying for almost every trading day for more than 3 weeks!)
- Heikin-Ashi signals turned bearish last friday, with strong momentum. In case price clears 9,30-9,35 resistance, selling will accelerate down to 9,00-9,10 zone.
- EWO is still neutral/starting bearish.
As I wrote on Twitter, I have been holding sometimes more sometimes less EURNOK short for several months now. I think it is time to hold more! If someone doesn't like selling EUR ag NOK, can still do another relative value trade, long NOKSEK, which I also called for on Twitter few days ago.
p.s.: Of course the whole success depends a lot on Brent Oil price action, as Norway is one of the world's biggest oil producers, but recently I see Oil price well supported by buyers.


BUY NOW - LOW RISK TRADELONG TRADE :
Entry : BUY @ 9.4600
Target : 9.7030
Stop : 9.3420
Risk Level : LOW
RR ratio : 1:2


EURNOKWhere are we going now ?
Wait and see, if up short if down long - i would not take a trade in the middle of nowhere
Trade your plan, if you don't have avoid trading
(Warning. I am a private trader. I don't sell any signals, equipment or other sources of learning about forex . I am here to share ideas based on technical analysis to improve me on Forex practice. Trading forex is dangerous and can result in significant financial losses. So I am not responsible when the results of the positions to be taken on the basis of my charts since these constitute no basic signals but simply my own market analysis. As i always says, trade your plan and if you don't have any, avoid trading.)
Update status


EURNOKBreak or not break the triangle
Here is the price on extension if goes to (let see)
Wait and see
Trade your plan - if you dont have any, avoid to trade - stay safe
Thanks for clicking the like button. In case of another view, questions or comments ? share it with pleasure More ideas following. Click the follow button to keep updated when I publish new ideas or update already published ones. Thanks for your visit !
Update status

EURNOK triangleQuite a solid symmetrical triangle forming here and getting very close to the apex.
Profit targets based on previous structure. (Zoom out to see lower target structure.)
Trade a close outside the triangle.


A short set up on the EUR/NOK.A Cup and Handle pattern formed from the highs of December 2008. The black horizontal level at 9.15202 provided strong resistance early to mid 2009 (red arrows), it came back into play December 2014 and January 2015 (red arrow) again providing strong resistance. From September 2015 until the end of the year that level became strong support (green arrow). A broadening formation from september 2012 has also formed and January of this year we failed to reach the upper trendline before heading back towards the lower trendline as well as the 9.15202 area where the last green arrow is placed. The high probability trade would be to enter short close to the red dotted upper channel trendline and close on the support level at 9.15202 or there abouts.
