FILUSD 1WFIL ~ 1W
#FIL Make purchases gradually in demand zone, With a long term target of at least 20%++
FILUSDT.P trade ideas

FILUSDT Elliott Waves AnalysisHello friends.
Please support my work by clicking the LIKE button👍(If you liked). Also i will appreciate for ur activity.
Everything on the chart.
Entry: Market and lower
Targets: 10 - 15 - 20 - 28
Stop: under 3.3 (depending of ur risk).
RR: 1 to 10
ALWAYS follow ur RM.
risk is justified
It's not financial advice.
DYOR!

FIL USDT - FILECOIN target 60 usd long
Filecoin is an open-source cloud storage marketplace, protocol, and incentive layer.
Filecoin can reach the price in the this year 60 $. Via price predictions.
Supply
Circulating: 548,552,289 FIL
Total: FIL 1,960,510,820 FIL
-
We are now on target, instant buy zone.
-
Please comment. Good luck! $$$$
This is not financial advice! Warning, price may fall less, 3.00 $ maybe more down.
Please do your analysis and consider investing!!

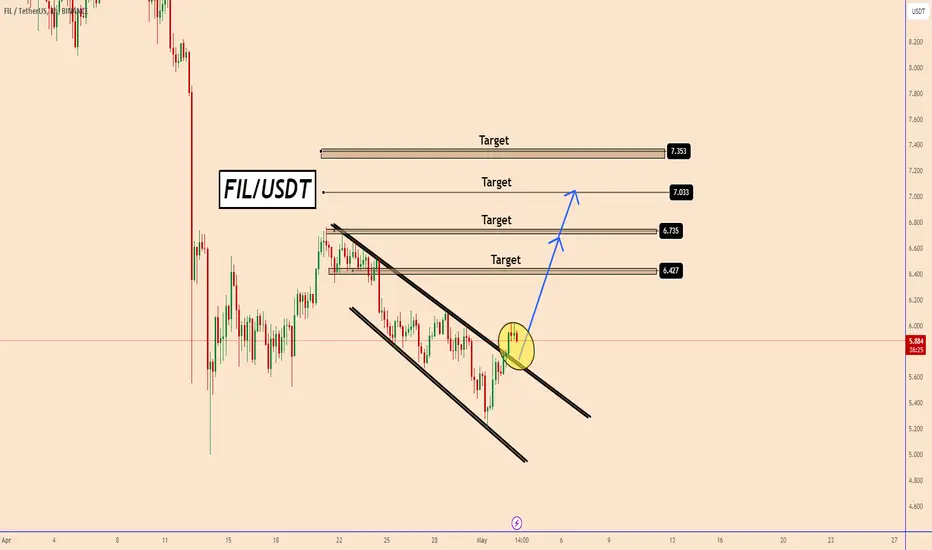
FIL: A possible Short-Term Rebound FIL: A possible Short-Term Rebound
FIL confirmed a bullish pattern on the 4 hour chart showing in this way the possibility
of a short-term rebound.
This could be related with the NFP data we have today and we can likely see FIL
testing the top of the small structure again.
Strong resistance will be found near 6.7
A breakout above 6.70 should push the price further up to 7 - 7.3
You may find more details in the chart!
Thank you and Good Luck!
❤️PS: Please support with a like or comment if you find this analysis useful for your trading day❤️
filusdt daily timeframefilusdt forming a double bottom pattren on daily time frame which is consider bullish pattren so keep Your eyes on.

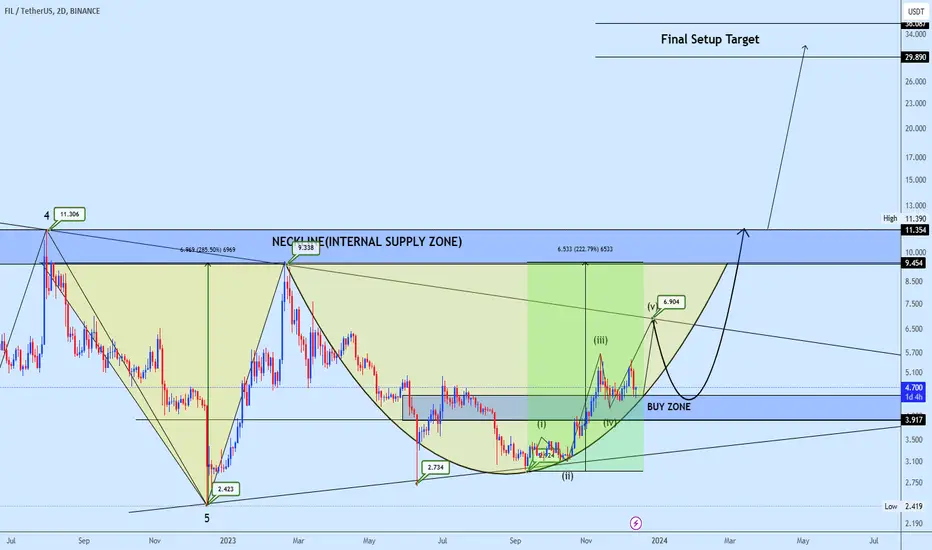
Filusdt Trading opportunityFilusdt is currently displaying a potential Adam & Eve reversal pattern, indicating a potential trend reversal. The completion of this pattern could trigger a final setup target in the range of $30 to $36.
The buy zone is an opportune area for accumulation, as investors can take advantage of potential price appreciation. However, it's important to note that the immediate resistance level lies at the setup neckline, which may pose a hurdle for further upward movement.
Please stay tuned for timely updates on this analysis. Feel free to leave your comments and don't forget to show your support by liking the post.
Thank you.
FIL buy with EZ7strategyAnalysis by EZ7strategy🎖️
1. **Price Levels**:
- In the chart, three important price levels for the digital asset FIL/USDT are indicated:
- **First Support Level**: If the price reaches the first support level (5.442$), it may serve as an entry point for buying.SL=4.952$
- **Second Support Level**: Similarly, if the price reaches the second support level (4.072$), it can also be considered as an entry point for buying.SL=3.655$
- **Latest Buy Level**: This point is also designated as an entry point for buying (3.431$).SL=2.911$
2. **Exit Points**:
- Determining exit points from a trade requires more detailed analysis of the chart and market conditions. However, generally, exit points may be at resistance levels or when the price reaches specific points.

FILUSDT - The accumulation phase is ending!The accumulation phase will end with the break of the resistance zone at $10.72 to $11.39 and the strong upward movement will begin.
TPs:
$16.5
$28
$41
$120
Good luck!

Alikze »» FIL | Big C or 3 wave scenarioIn the daily and weekly time, it is moving in an upward channel, which according to the previous analysis , the last wave had the ability to grow to around 100% of the previous wave, after which it faced correction, which was correctly mentioned in the updates of the previous post. And extended to the specified area of correction.
💎 First scenario: Therefore, if this last correction, which is extended in the form of three waves up to the green box range, is completed and its structure does not constitute a complex combination correction, we can expect a sharp super cycle of wave C or 3 from it. In the first step, it will conquer the ceiling of the previous major and after that it can touch the specified supply area.
💎 Alternative scenario: If the green box range is broken, this correction can extend further to the $4 range and then to $3.125, in which case it should be updated again.
If the behavior and structure of the post changes, it will be updated.
»»»«««»»»«««»»»«««
Please support this idea with a LIKE and COMMENT if you find it useful and Click "Follow" on our profile if you'd like these trade ideas delivered straight to your email in the future.
Thanks for your continued support.
Sincerely.❤️
»»»«««»»»«««»»»«««


$FILreclaimed 200 on the H! btc pair
deviation for now
reclaim and shall add more
targeting range high or a HH from previous run
rsi curling up looks reset

FILUSDT long spot trade / after the last correctionafter the last correction CFX break the Base Channel and entered wave 2 territory, and as I see BTC and ETH not complete there correction wave yet, and the same case with most of the other Crypto, so that mean that the price will go deeper, which make our 5 impulse Wave Idea invalid.
FILUSDT Elliott Wave Technical Analysis
Mode: Corrective
Structure: Extended Flat
Position: Wave (c) of (X)
Direction: Wave (c) of (X) is still in play
Details: Wave (c) is still in play which I expected to be end around 4.2-3.4 which will be my entry point.
Next Direction: next higher Degrees Wave (Z)
Targets:
10.4 with 170% profit
11.8 with 200% profit
the area between 12.9-13.1 with 240% profit
Wave Cancel invalid level: Daily closing below 2.7 with 30% loss
Disclaimer:
This analysis is intended for educational and informational purposes only and should not be construed as financial advice. Always conduct your own due diligence and consult with a professional financial advisor before making investment decisions.
Closer look on the current correction wave on the 1D Frame:

it.s my idea see this people and buy this big longhi again buy in the box and stop below the box r/r is great have good year

SasanSeifi 💁♂ Daily Analysis with Key Support Zones🔻 Hey there, Let's take a look at the daily timeframe of BINANCE:FILUSDT .
As you can see, the price has been on a downtrend since the $11 zone. Currently, after some minor fluctuations, it has been rejected from the 200 EMA and is trading around $5.50. The price is more likely to move downwards. If it consolidates below $5.35, we can expect a further correction toward the SELL SIDE LIQUIDITY and the $4 demand zone.
Key support levels are $4 and $3.50. There is a higher probability of a positive reaction from the $4 demand zone. In case of a correction, we need to see how the price reacts.
The potential trend is also highlighted in the chart above. Additionally, if the $4 zone breaks down, the $3.50 correction target can be considered.
Remember, this is just my personal analysis, not financial advice. Do your own research and make informed decisions.
Happy trading!✌😎
Sure, if you have any more questions or need further clarification, feel free to ask. I'm here to help!✌
if you found my analysis helpful, I would appreciate it if you could show your support by liking and commenting. Thank you!🙌

Filecoin Starting?the chart is simple...
Filecoin is starting...
Ichikumo is telling, order blocks too
enjoy the ride!

Does FIL Worth To Invest In ?!FileCoin is one of the most productive projects in the crypto world. It's because of its considering whitepaper and major investors. So this is why you should dedicate a bit for it!
There two buy steps:
1) 4.60
2) 3.80
Also midterm targets are shown on the chart above.

Uptrend in case of failure?BINANCE:FILUSDT Analysis of the four-hour time frame:
For buyers, a break of the 6.178 resistance zone can continue the uptrend to the next resistance zone of 6.579.
For sellers, a break of the 5.682 support area could continue the downtrend to the next support area of 4.928.

FILUSDT 4H Analysis wave style neo waveyhis analysis can be a classroom for people who work in elliot,s

📈 FIL Trading Analysis 🚀Support Level Opportunity:
FIL retraced to the current support level two days ago and has shown stability. Consider a long position from here.
Trade Parameters:
Entry: $5.85.
Take Profit: $6.75-$7.00 or $7.75-$8.10.
Stop Loss: Just below $5.70.
Market Observation:
Recent market trend indicates a range-bound pattern.
If FIL struggles to surpass the next resistance, consider exiting to secure profits, as with SOL.
📊🔍 Stay vigilant for FIL's movement! #FILTrading #CryptoAnalysis 💰📈

Fil Pretty Clean BUY SetupNice RR from here.
LL Longed and spot loaded under 6.1.
Invalidation Clean break below 6.
Holds here and can send Quick.
Targeting above 8.
Note: Not a Financial Advise.

📊#FIL may have completed a weekly level correction✔️🧠After we reached the first target at the weekly level, there was an adjustment corresponding to the cycle, which is very reasonable. Prices are now back within the weekly buy zone and have established a double bottom bull structure, so we have the opportunity to bounce back from here.
➡️If we can continue to break through the previous high, then our ideal target area can be seen at 16.771-21.233, so it is reasonable to hold some FIL from here.✔️
Let's see👀
🤜If you like my analysis, please like 💖and share it💬
💕 Follow me so you don't miss out on any signals and analyze 💯

FILECOIN can ascend further ! What Shall we Expect ?Hi.
BINANCE:FILUSDT
FIL is in an ascending triangle which means the price is about to do a good bullish movement. The price can increase as much as the measured price movement ( AB=CD ) .The break out needed for increasing further has not happened but it should happen pretty soon.
✅ Due to the Ascending structure of the chart...
🟢 FIL has been Bullish Recently!
🟢 The odds of another Bullish Movement is High!
🟢 Ascending Triangle is Visible on The chart!
🟢 No break out yet!
✨Targets are:
🎯$6.730
🎯$6.830
🎯$6.970
🎯$7.200
🎯$7.480
🎯$7.770
🎯$8.170
🎯$8.400
❗ Note that if the Triangle is broken down with the power of descending candles, our analysis will fail.
Stay awesome my friends.
_ _ _ _ _ _ _ _ _ _ _ _ _ _ _ _ _ _ _ _ _ _ _ _ _ _ _ _ _ _ _ _ _
✅Thank you, and for more ideas, hit ❤️Like❤️ and 🌟Follow🌟!
⚠️Things can change...
The markets are always changing and even with all these signals, the market changes tend to be strong and fast!!

Bullish Continuation(W/ Projctns)A bullish reversal harmonic that has return extension targets, was discovered on the Daily Time frame for Filecoin, TSX:FIL -USDT. This harmonic, coupled with the current Crypto Bull Market of '24, which we're in, suggests a bullish continuation
