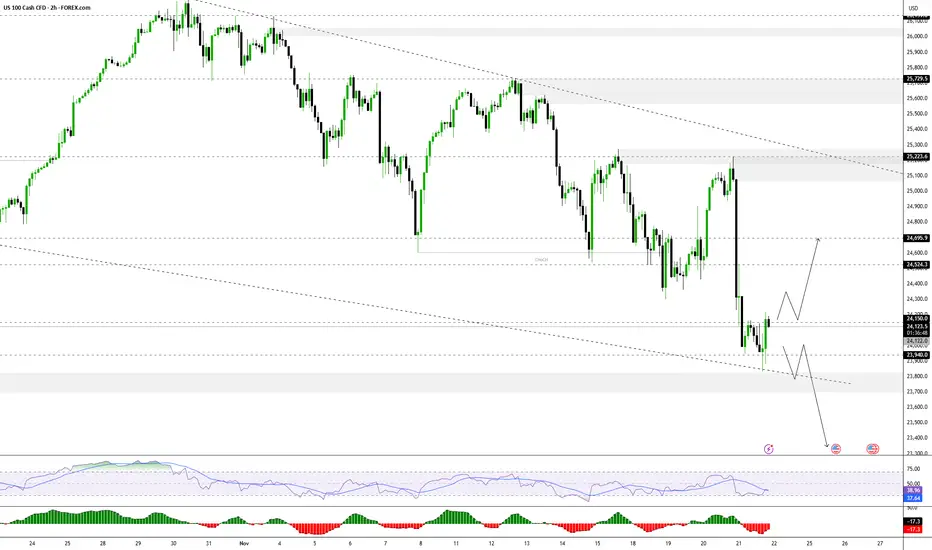
Nasdaq Short: Ride the wave 3 of 3 of 3In this video, I updated the Elliott Wave counts for Nasdaq and shows how wave 3 has formed as a series of sub-waves. I also showed that the last wave up (wave 2 of 3 of 3) was stopped at 50% retracement of wave 1 of 3 of 3. So my expectation is that next week we are going to crash in a wave 3 of 3 of 3.
Set the stop for this idea will be above wave 2 of 3 of 3 (around $24,540).
Good luck!
Market insights

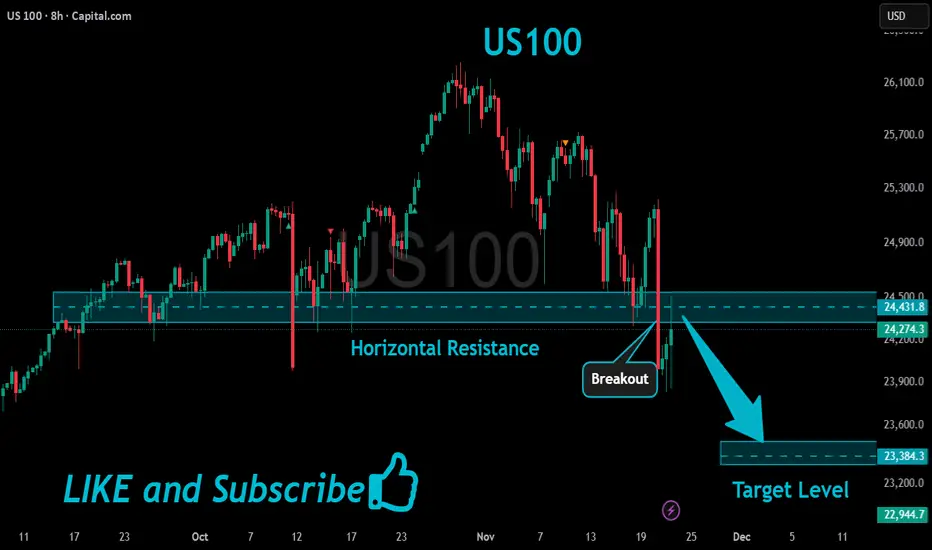
US100 Potential Short!
HI,Traders !
#US100 is making a rebound
But we are bearish biased
And after hits the
Horizontal resistance of 24431.8
We will be expecting a
Local bearish correction !
Comment and subscribe to help us grow !
NAS100 1:1.5 RRThis is a trade idea, posting for future reference
not to be taken as financial advice

Nasdaq The #1 Fear Of Investors BuyingLet me tell you what i did
i searched google and then i type
fear and greed index of the stock market
A page appeared and i saw the link
it took me to a famous
news website
where i saw something very shocking.
The gauge was on extreme fear.
The last time this appeared was in April
of 2025.
Now look at this chart on top..
You will see the RSI
its in the buying channel
because its oversold
This channel is showing
you the right place to buy this stock at a affordable price.
The main stream media
and your favourite Guru
is not talking about this
market recovery
Because its not easy to see unless you
understand trading systems.
Am ready to buy this
are you?
Rocket boost this content to learn more
Disclaimer: Trading is risky please learn risk management and profit
taking strategies.Make sure
you use a simulation trading account before you
trade with real money.

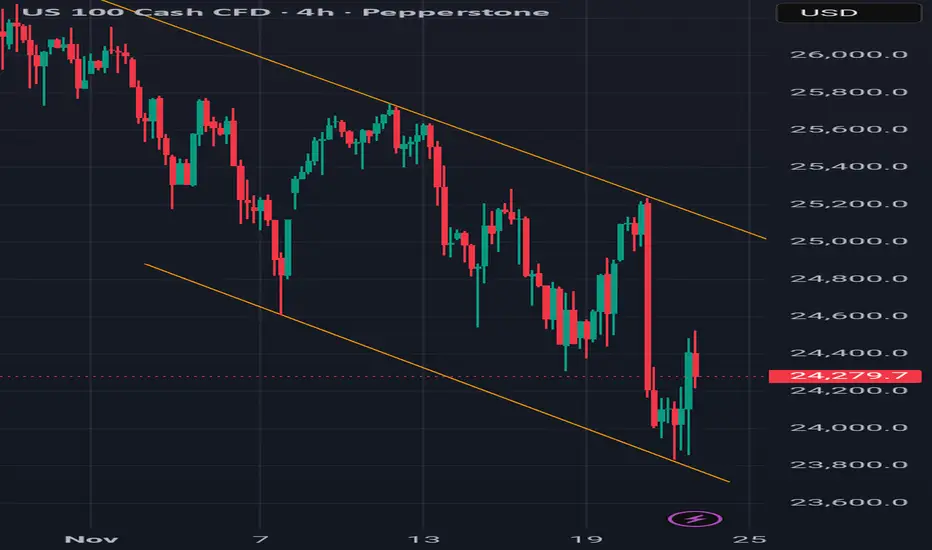
Momentum meets structure - Asset: US 100 Cash CFD
- Timeframe: 4H
- Structure: Descending channel (bearish trend)
- Momentum: Stochastic RSI (14,3,3) rising from oversold
- Event: Price bounced off lower trend line with stochastic confirming upward momentum
1. Trend Line Structure
- The descending channel defines a bearish environment.
- Price touches the lower boundary → potential support zone.
- This is a structural signal: price may bounce within the channel.
2. Stochastic Confirmation
- Stochastic RSI was in the oversold zone (<20).
- Lines are now crossing upward, signaling momentum shift.
- This is a momentum signal: buyers are stepping in.
3. Confluence = High-Probability Setup
- Structure (trendline support) + Momentum (stochastic reversal) = confluence.
- This increases the probability of a short-term bullish move toward the upper trend line.
-Price action within a descending channel shows a bounce off support. Stochastic RSI confirms momentum shift from oversold. This confluence offers a textbook example of how structure and momentum combine for a high-probability setup.
This setup teaches traders to:
- Wait for confluence, not isolated signals.
- Use stochastic to confirm trend line reactions.
- Respect the channel boundaries for targeting and risk.
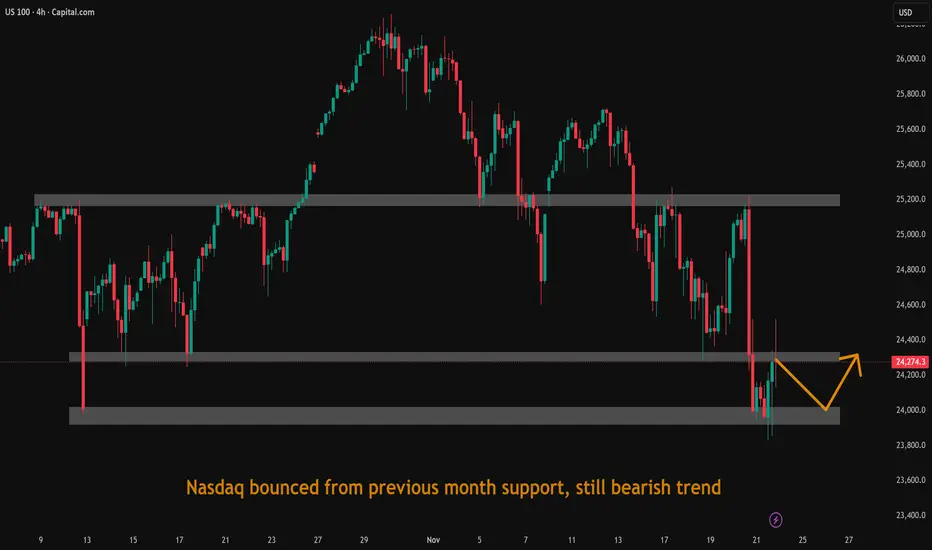
Nasdaq bounced from previous month support, still bearish trendNasdaq bounced from previous month support, still bearish trend.
US100 (NASDAQ) — Daily CLS RangeUS100 (NASDAQ) — Daily CLS Range
Daily CLS ,
2nd candle is now complete, establishing the range.
On the 1H chart, a pullback into the BPR zone would provide a high-probability entry, supported by strong confluence at this level.
Target: Daily 50% midpoint at 25,287.6

NASDAQ: Got a A plus Setup for the Nasdaq 100, Just long and chiNasdaq index seems like buy the dip and forget... NASDAQ: Got a A plus Setup for the Nasdaq 100, Just long and chi

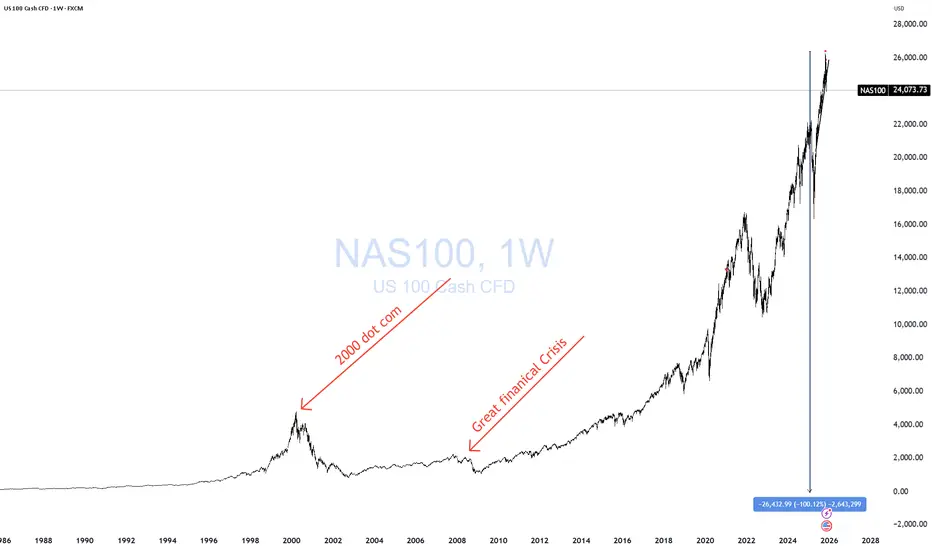
NDX - 92% From ZeroI want you to always remember one thing:
Wherever the price goes, it’s always 100% from zero.
That’s why every now and then you need to take the chart off log and look at it with fresh eyes.
Occam’s razor.
I keep hearing the PERMA-BULL crowd screaming that “the bears are calling this an AI bubble,” and in the same breath whining that the pullback is “overdone” or “extreme.”
Really?
The S&P is down 5%, and they’re already crying about the bears?
SMH.
It’s all strawman nonsense. Don’t fall for it.
Take it off log…
Remember everything is 100% from zero…
Use your basic, instinctive judgment…
And then ask yourself what your eyes are telling you when you look at this chart.
That’s the truth — not the narratives.
THANK YOU for getting me to 5,000 followers! 🙏🔥
Let’s keep climbing.
If you enjoy the work:
👉 Boost
👉 Follow
👉 Drop a solid comment
Let’s push it to 6,000 and keep building a community grounded in truth, not hype.
NasdaqBullish nasdaq as price went to restest the strong demand zone ans respected the price zone. Now more bullish momentum expected till our initial resistance.

NSDQ100 selling pressure below 24630 resistanceKey Support and Resistance Levels
Resistance Level 1: 24630
Resistance Level 2: 24920
Resistance Level 3: 25100
Support Level 1: 23816
Support Level 2: 23600
Support Level 3: 23300
This communication is for informational purposes only and should not be viewed as any form of recommendation as to a particular course of action or as investment advice. It is not intended as an offer or solicitation for the purchase or sale of any financial instrument or as an official confirmation of any transaction. Opinions, estimates and assumptions expressed herein are made as of the date of this communication and are subject to change without notice. This communication has been prepared based upon information, including market prices, data and other information, believed to be reliable; however, Trade Nation does not warrant its completeness or accuracy. All market prices and market data contained in or attached to this communication are indicative and subject to change without notice.

Could the drop be over?Technical: The index is sitting around 22,078 points, dropping approximately 2.15%.
Fundamental: The decline is linked to a reversal of momentum after NVIDIA Corporation’s strong earnings; although the results were solid, the market interpreted that risks related to interest rates and valuations may still persist.
Key: Keep an eye on the upcoming Federal Reserve interest rate decision and the evolution of employment data, as the market remains sensitive to whether rate cuts will occur or not.

NAS100 Trade Set Up Nov 21 2025Price is still under strong bearish pressure to i will look for internal 1m-5m structure to take sells to lower SSL levels

NASDAQ | Potential for Upside if Positive Tone is MaintainedNASDAQ Market Outlook | Potential for Upside if Positive Tone is Maintained
Currently, the NAS index remains under bearish pressure. Concerns about an AI bubble continue to weigh on technology stocks, even though Nvidia recently reported its highest revenue ever of $57 billion with strong growth guidance.
However, investors remain cautious due to the massive increase in spending on AI, perceived overvaluation of stocks, and the market's reliance on a few mega-cap companies.
Under these conditions, selling pressure in the technology sector continues and is affecting the movement of the USNAS100 index.
Price movement direction based on key levels:
As long as the price is below 23,940 → the trend remains bearish.
If the decline continues, the gradual decline target is in the following areas:
🔻 23,700 → 23,340 → 23,050
If the price rises and closes above 24,150 on the H1 timeframe → potential bullish correction
The corrective upward trend has the potential to move towards:
🔺 24,350 → 24,570
Analysis Conclusion
USNAS100 remains in a bearish trend as long as the price is unable to break through and maintain above the 23,940 level. Selling pressure is expected to intensify if the 23,700 support level is broken, opening the opportunity for a decline towards the 23,340 to 23,050 area.
US NAS 100DO YOU KNOW WHATS BEHIND THIS OR OTHER IDEAS?? in bio..
Preferably suitable for scalping and accurate as long as you watch carefully the price action with the drawn areas.
With your likes and comments, you give me enough energy to provide the best analysis on an ongoing basis.
And if you needed any analysis that was not on the page, you can ask me with a comment or a personal message.
Enjoy Trading ;)

NAS100 Sits at Key LevelPrice is sitting right on top of major support. This level has been holding up nicely before, and it's also a strong psychological round number, which means buyers naturally defend it harder.
This is where buyers stepped in aggressively the last time. And where reactions tend to be violent.
This is the market literally waiting for a catalyst.
And here’s the important part:
If buyers manage to hold this zone?
We could easily see price pushing back toward 24,750.
BUT…If this support gives way…Then everything changes.
A breakdown here would invalidate the bullish structure entirely and starts a larger bearish move. When a level this strong breaks, it usually drops hard and strong.
So right now, the market is at a crossroads.
A clean break + retest below this level would confirm it.
In short:
👉 Hold the zone → bullish push toward 24,750
👉 Lose the zone → strong bearish continuation

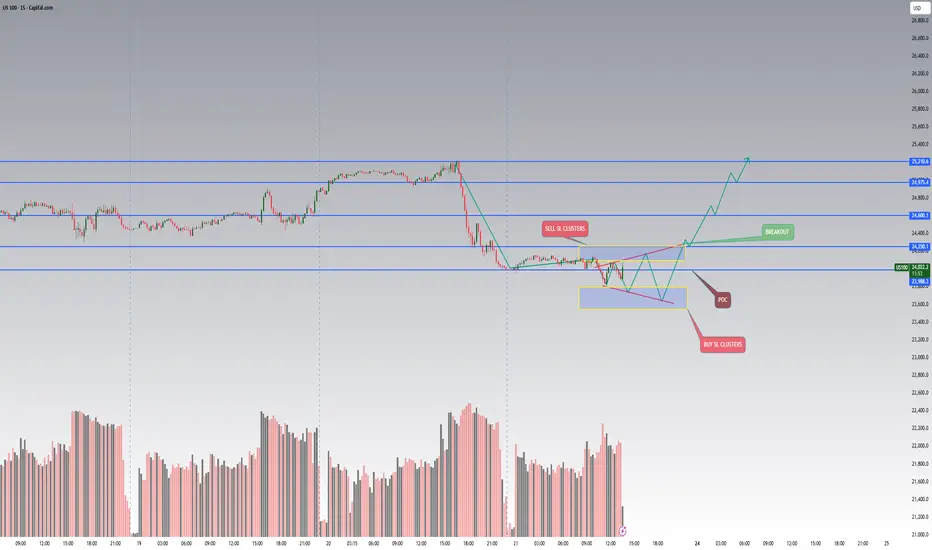
Why Markets Struggle After a Big Drop (NASDAQ Case Study)Understanding liquidity, distribution phases and market-maker behavior
After the NASDAQ fell sharply from 25 000 to 24 000, many traders were surprised why the market suddenly stopped moving and started to “chop” around the same area.
But this behavior is not random — it’s a structural problem inside the order-flow.
1️⃣ Markets can fall fast — but they cannot continue without liquidity
Every trade in the market has a counter-party.
If traders want to buy the dip, someone must sell to them.
After a large drop, fewer participants are willing to sell at the new low prices.
Institutions are often already hedged or already sold during the fall.
Market makers cannot force liquidity out of thin air — they must create it.
This leads to a distribution phase, where price stops trending and starts rotating around a key area.
2️⃣ Why distribution forms around the Point of Control (POC)
When aggressive hedging is finished and volatility slows down, the market enters a phase where:
Price rotates around the Point of Control (POC)
Volume increases
Market makers attempt to rebuild liquidity on both sides of the range
This is not accumulation or re-accumulation — it is a liquidity-engineering phase.
Market makers need enough:
Buy-side liquidity above POC (stop losses of shorts, breakout traders, trapped buyers)
Sell-side liquidity below POC (stop losses of longs, late dip-buyers, liquidation clusters)
Without these pools, the market cannot initiate the next impulsive move.
3️⃣ The problem with sell-side liquidity after a big fall
When NAS dropped from 25k → 24k:
Most weak longs were already liquidated
Many sellers closed positions or took profit
Fresh shorts hesitate to enter at the lows
Institutions are waiting for better prices
This creates a liquidity vacuum.
To solve this vacuum, the market “mirrors” trades inside the range:
Price moves up → build stops above
Price moves down → build stops below
Repeated sweeps → fill both sides of liquidity
Only after enough stop-loss clusters form, the market is capable of moving again with real momentum.
4️⃣ What this means for traders
This is not a buy or sell signal.
It’s an explanation of why the market becomes extremely slow, sideways or manipulative after a big impulsive move.
In this phase:
Breakouts usually fail
Trend trading performs poorly
Range traps occur frequently
Market reacts strongly to liquidity pockets, not fundamentals
The key is to understand what the market is missing:
➡️ Not direction.
➡️ Not fundamentals.
➡️ But liquidity.
Until the liquidity pools are recreated, the next real directional move cannot start.
5️⃣ Final takeaway
A strong decline does not end because “buyers step in.”
It ends because no more sellers exist at those levels, forcing market makers to rotate price and rebuild the order-book.
Learning to identify these liquidity-reset periods helps traders avoid:
Chasing breakouts
Entering too early
Getting trapped during fake momentum
Misreading sideways distribution as a reversal
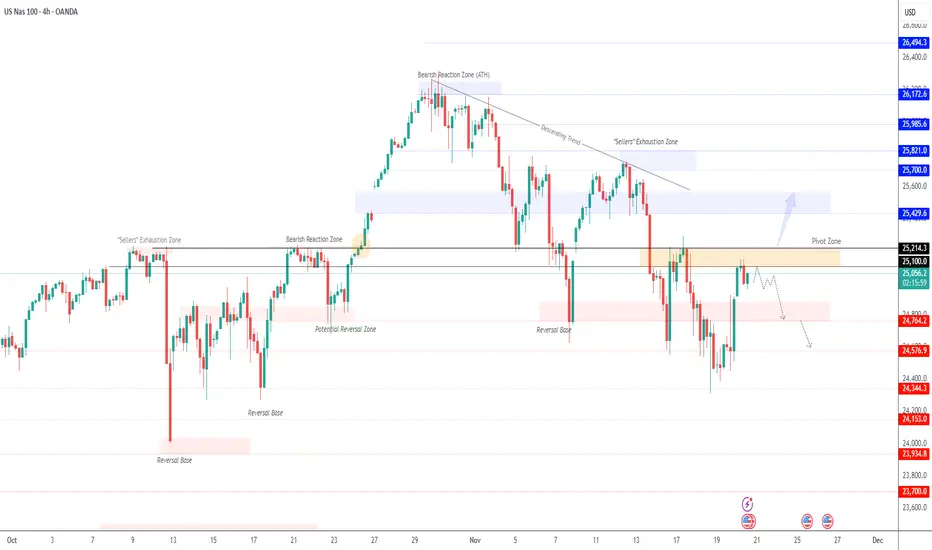
USNAS100 –Key Breakout Levels | Bearish Below 25100 Ahead of NFPUSNAS100 | OVERVIEW
NASDAQ futures surged as Nvidia’s strong earnings eased concerns of an AI-driven market bubble, boosting overall tech sentiment.
Markets are now shifting attention to the NFP and U.S. jobs report, with expectations of elevated volatility throughout the NY session, especially given Nvidia’s strong influence on tech stocks.
Technically:
Below 25100: Bearish continuation toward 24880 → 24760 → 24350
Above 25215: Bullish breakout toward 25430 → 25650 → 25700
Pivot: 25100
Support: 24880 · 24760 · 24350
Resistance: 25220 · 25430 · 25650
USNAS100 stays bearish under 25100; only a confirmed close above 25215 will signal bullish continuation.
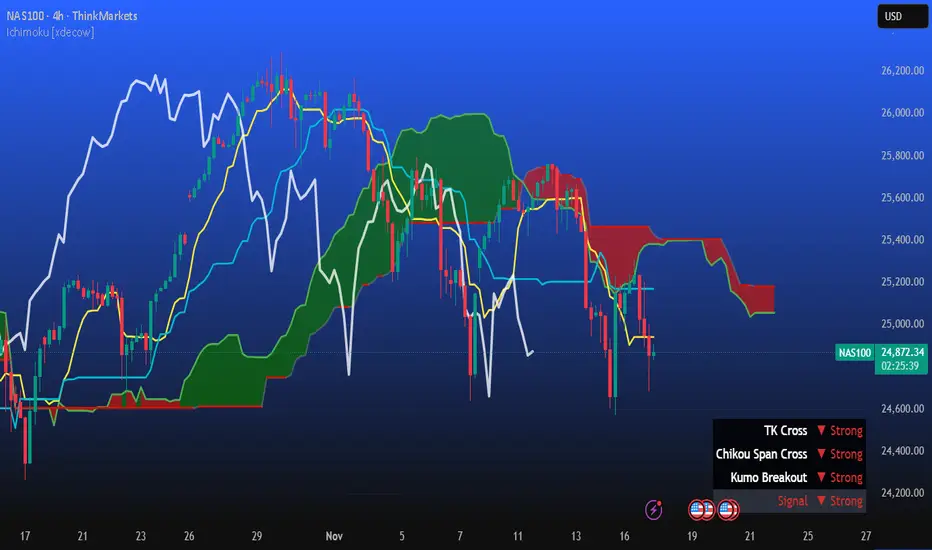
NAS100 - Waiting for buy setup on 4hr timeframeTimeframes Used: Monthly → Weekly → Daily → 4H
Current Market Condition:
Nas 100 is a valid trade according to my system rules:
Monthly: Price is above the Cloud → Bullish
Weekly: Price is above the Cloud → Bullish
Daily: Price is above the Cloud → Bullish
----------------------------------------------------------------------------------------------------------------
What I’m Waiting For:
I’ll be watching for the next 4H breakout opportunity.
Price to break above the 4hr timeframe.
NAS100 H4 | Potential bullish reversalMomentum: Bearish
The price may experience a short-term pullback toward the identified buy-entry level, which aligns with a key pullback-support zone.
Buy Entry: 24,851.44
Pullback Support
Stop Loss: 24,362.73
Multi Swing-Low Support
Take Profit: 25,774.15
Pullback Resistance
High Risk Investment Warning
Stratos Markets Limited (tradu.com ), Stratos Europe Ltd (tradu.com ):
CFDs are complex instruments and come with a high risk of losing money rapidly due to leverage. 70% of retail investor accounts lose money when trading CFDs with this provider. You should consider whether you understand how CFDs work and whether you can afford to take the high risk of losing your money.
Stratos Global LLC (tradu.com ): Losses can exceed deposits.
Please be advised that the information presented on TradingView is provided to Tradu (‘Company’, ‘we’) by a third-party provider (‘TFA Global Pte Ltd’). Please be reminded that you are solely responsible for the trading decisions on your account. Any information and/or content is intended entirely for research, educational and informational purposes only and does not constitute investment or consultation advice or investment strategy. The information is not tailored to the investment needs of any specific person and therefore does not involve a consideration of any of the investment objectives, financial situation or needs of any viewer that may receive it. Past performance is not a reliable indicator of future results. Actual results may differ materially from those anticipated in forward-looking or past performance statements. We assume no liability as to the accuracy or completeness of any of the information and/or content provided herein and the Company cannot be held responsible for any omission, mistake nor for any loss or damage including without limitation to any loss of profit which may arise from reliance on any information supplied by TFA Global Pte Ltd.

Rising Expanding Wedge BreakdownI’ve spotted this expanding wedge pattern on the Nasdaq and there is probably more downside imminent for the Nasdaq. I'm sure this isn’t new to most of you. A bearish price target around 23,000 (for now) is highly likely. Long-term I remain bullish (see my other ideas), but right now the extreme fear is handing control to the bears for a while.

NAS100 BuyThe recent drop in the Nasdaq is largely tied to fears that the AI rally has become overheated, with major tech names pulling back sharply as investors question whether recent gains were justified. Much of the selloff reflects anxiety rather than a breakdown in fundamentals, as highlighted by concerns over an AI bubble in the CBS News report. However, this correction also sets the stage for a potential bullish reversal. The long-term growth story for AI remains intact, and strong underlying fundamentals could draw buyers back once panic selling eases. Market overreaction often creates attractive entry points for institutional investors, especially if leading tech companies deliver solid earnings or upbeat guidance. A shift in Federal Reserve tone toward more supportive policy would also boost growth stocks significantly. With investor sentiment still optimistic about the future of technology despite short-term volatility, the Nasdaq has room to recover and potentially resume its broader uptrend.

Nasdaq 100 drops to a new low on the weekWhat a sell-off! The Nasdaq 100 (-2%) has now dropped almost 1,000 points from earlier high, to relinquish its entire gains related to Nvidia (-1.6%) and some to hit a new low on the week. How much more selling in there to come? Judging by price action in the crypto space, I would say a fair bit more.
By Fawad Razaqzada, market analyst with FOREX.com
