NAS100 Trade Set Up Nov 4 2025Price is bearish making LH/LL on the 1h and 15m, has already swept BSL/London highs and inverted 15m FVG so i will be looking for sells down to SSL/London lows
Trade ideas

US100 consolidation a bullish Phase TrendThe US100 remains within a short-term bearish trend, though recent price action suggests a potential recovery phase if support levels hold.
Technically Wall Street futures gained on Monday, marking a positive start to November. The move was supported by renewed optimism around oil demand and hopes of progress in U.S.–China trade relations, boosting overall risk appetite.
Key technical levels:
Resistance: 26,400 — A sustained move above this level could confirm bullish momentum and open the path for further gains. 25,700 If prices retrace to this zone and hold, we could see renewed buying pressure as investors position for a rebound a decisive break below 25,700 would likely signal a continuation of the downtrend, inviting further downside. In the short term, expect some volatility as the index tests these critical levels. If buying interest remains strong near support, the US100 could resume an upward correction, giving investors an opportunity to take short- to mid-term profits.
You may find more details in the chart.
Trade wisely best of Luck Buddies.
Ps; Support with like and comments for better analysis Thanks for Supporting.

Nasdaq 100 Analysis: Early November Movements Raise ConcernsNasdaq 100 Analysis: Early November Movements Raise Concerns
As the chart shows, the Nasdaq 100 index gained around 6% in October, supported by several key factors:
→ The meeting between US President Donald Trump and Chinese leader Xi Jinping, which helped ease tensions in trade relations between the world’s two largest economies.
→ A 0.25% rate cut by the Federal Reserve.
→ Positive earnings from major tech companies, including a strong report from Alphabet (GOOGL).
However, the market’s behaviour in early November is cause for concern — on the morning of 4 November, the stock index fell to its lowest level in a week. Bearish sentiment is being fuelled by:
→ uncertainty over the timing of the end of the government shutdown;
→ a weaker-than-expected ISM Manufacturing PMI report, which may reflect the impact of Trump’s tariffs on US industry.
Technical Analysis of the Nasdaq 100 Chart
Analysing the hourly chart of the Nasdaq 100 on 30 October, we:
→ confirmed the relevance of the upward channel (shown in blue), noting that the upper boundary was showing signs of resistance;
→ drew a steeper trajectory consisting of three orange lines;
→ suggested a profit-taking scenario, in which bears would attempt to push the Nasdaq 100 index down towards the median line of the blue channel.
This scenario has since materialised, as:
→ the median line has repeatedly acted as support (highlighted in blue);
→ the breakout level of the orange lines at 26,120 has turned into a resistance zone.
At present, the Nasdaq 100 index is trading in the lower half of the channel, indicating that the bullish momentum from late October has faded. Bulls might find support near the gap area, reinforced by the lower boundary of the blue channel.
This article represents the opinion of the Companies operating under the FXOpen brand only. It is not to be construed as an offer, solicitation, or recommendation with respect to products and services provided by the Companies operating under the FXOpen brand, nor is it to be considered financial advice.


US100How to become successful in forex and stock trading:
1.Master fundamentals and technical analysis.
2.Build and follow a solid trading plan.
3.Apply strict risk management (4–6% rule).
4.Stay disciplined—control fear and greed.
5.Record and analyze every trade.
6.Focus on high-quality setups only.
7.Diversify across assets and markets.
8.Keep evolving—study, adapt, and grow daily.

NAS100 Trade Set Up Nov 3 2025If price trades into PDH first i will wait for internal bearish structure to catch sells down to SSL/London Lows but if price comes to test 1h FVG first and respects it i will look for internal structure to catch buys to PDH

US100 Technical Analysis! BUY!
My dear friends,
US100 looks like it will make a good move, and here are the details:
The market is trading on 25826 pivot level.
Bias - Bullish
Technical Indicators: Supper Trend generates a clear long signal while Pivot Point HL is currently determining the overall Bullish trend of the market.
Goal - 25982
Recommended Stop Loss - 25749
About Used Indicators:
Pivot points are a great way to identify areas of support and resistance, but they work best when combined with other kinds of technical analysis
Disclosure: I am part of Trade Nation's Influencer program and receive a monthly fee for using their TradingView charts in my analysis.
———————————
WISH YOU ALL LUCK

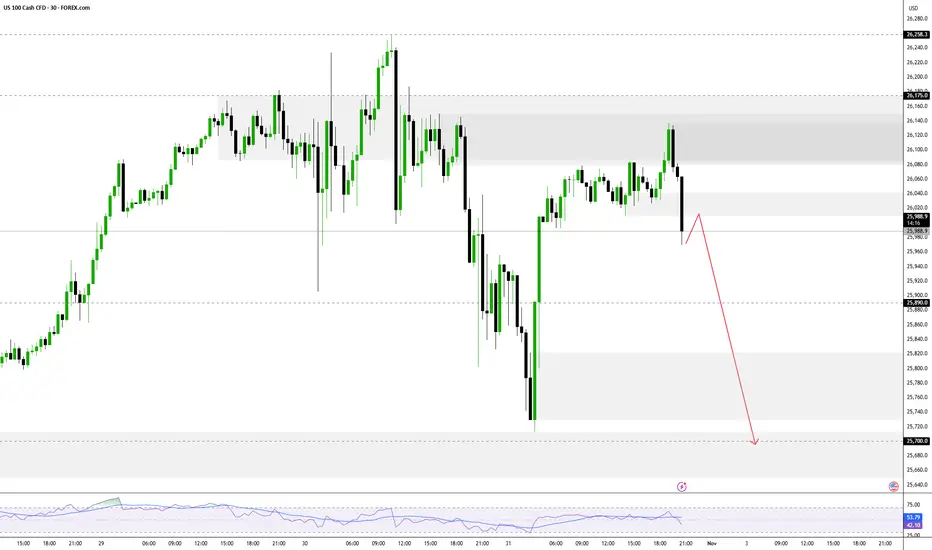
NasdaqNasdaq is showing a correction pattern after a previous upward movement. The price closed below the old support zone and was rejected, confirming a resistance zone at 25,923.4.
The loss of this support reinforces the continuation of the corrective movement, with a projected drop towards the next support zone at 25,569.8, a point where there is convergence with the previous low and a potential area for absorbing buy orders.

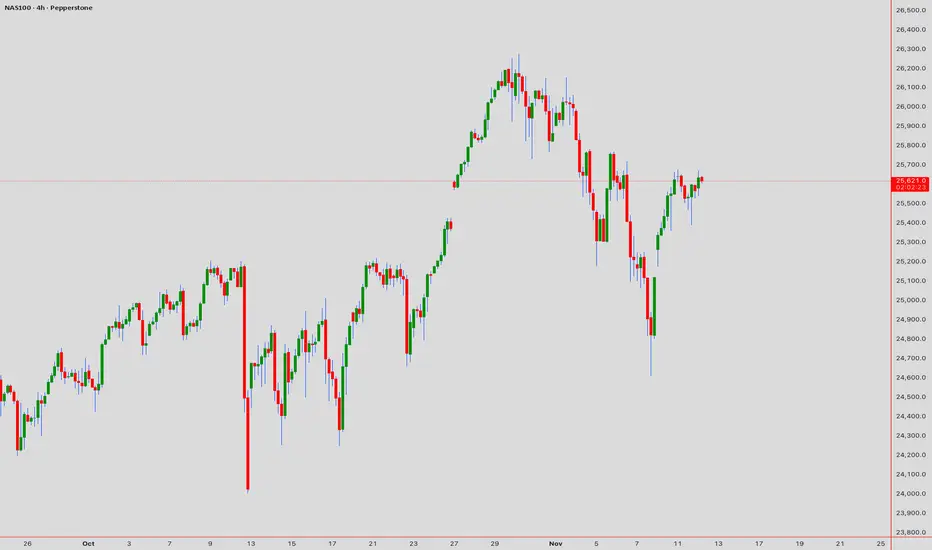
US100 (NAS100) The Tech Sector's Next Breakout📊 Technical Context: The Range-Bound Reality
The 4-hour chart reveals that the NAS100 is currently entrenched in a narrow consolidation channel, forming a high-probability decision zone. The recent price action has tested a pivotal support region following a downward correction from the peak.
Key Structural Levels (Based on 4H Chart):
• Current Pivot: The index is trading near 25,866.9, which sits just above the primary consolidation floor.
• Immediate Resistance (Ceiling): The first significant barrier is the zone around 26,167.3.
• A definitive 4H candle close above this level would signal a short-term bullish breakout.
• Critical Support (Floor): The key technical floor is the consolidation range low near 25,560.0. This level must hold to maintain the current neutral to bullish structural bias.
Upside Targets:
• A break above 26,167.3 unlocks the path to the first swing high target at 26,566.8 (a +278.0 point move from the ceiling).
• The major continuation target sits at the recent swing high of 27,004.0 (a total upside potential of approximately +719.6 points).
Downside Targets:
• A decisive 4H candle close below 25,560.0 would invalidate the immediate range.
• The next major support and downside target is exposed at 25,217.4 (a downside target of approximately -519.2 points).
Technical Verdict: The market is poised for a volatility expansion move once a clear breakout occurs from the 25,560.0 - 26,167.3 range. The longer the consolidation persists, the more forceful the eventual move is likely to be.
📰 Fundamental Headwinds & Tailwinds
To achieve an Editor's Pick, this technical setup must be grounded in the macroeconomic forces driving the technology sector (NASDAQ's primary composition).
The Fed & Interest Rates (High Volatility Risk):
• The price action is highly sensitive to signals regarding interest rate cuts.
• Hawkish Commentary (Headwind): Any shift to a tighter monetary stance by the Federal Reserve (Fed) could quickly lead to a break of the 25,560.0 support, as higher rates reduce the present value of future earnings for growth stocks.
• Dovish Commentary (Tailwind): Signals indicating a pause or potential for future cuts will act as a strong fundamental catalyst, likely fueling a breakout toward 27,004.0.
Corporate Earnings and GDP Data (Directional Catalysts):
• Positive Earnings: Strong quarterly reports from the 'Magnificent Seven' (the largest NASDAQ components) are essential. Positive surprises can provide the fundamental fuel needed for a break above 26,167.3.
• Inflation/Employment Data: Upcoming releases of major economic indicators (such as the Consumer Price Index or Non Farm Payroll) will dictate market sentiment. Reports suggesting persistent inflation are a risk factor, while softening data supports a relief rally.
💡 Potential Trading Strategy
Traders should adopt a reactive, breakout-based strategy rather than anticipating the direction within the current range.
1. Bullish Breakout (Long Setup):
• Entry Confirmation: Wait for a clean 4H close above the resistance zone of 26,167.3 on increased volume, ideally coinciding with a positive fundamental catalyst.
• Initial Target: 26,566.8.
• Secondary Target: 27,004.0.
• Risk Management: Place a stop loss just below the consolidation ceiling (e.g., 26,000.0).
2. Bearish Breakout (Short Setup):
• Entry Confirmation: Wait for a decisive 4H close below the critical support of 25,560.0, triggered by adverse fundamental news or technical momentum.
• Initial Target: 25,217.4.
• Risk Management: Place a stop loss just above the broken support (e.g., 25,750.0).
FINAL SUMMARY
The NAS100 is presenting a high conviction "wait and confirm" setup. The technical structure provides clear boundaries, while the fundamental landscape (Fed policy and earnings) is poised to deliver the catalyst. Do not trade the range; trade the break.


USNAS100 / Fed Caution and Earnings Weigh on MomentumUSNAS100 – MARKET OUTLOOK | Futures Stall Near Highs as Fed Turns Cautious 🇺🇸
Wall Street futures held near record levels after the Fed’s 25bps rate cut, as traders weighed Powell’s cautious tone, Big Tech earnings, and a new U.S.–China trade deal.
🔽 Below 26,170: Bearish momentum toward 26,050 → 25,890 → 25,700.
🔼 Above 26,180: Trend turns bullish toward 26,500 → 26,850.
Pivot: 26,170
Support: 26,050 · 25,890 · 25,700
Resistance: 26,300 · 26,500 · 26,850
USNAS100 remains bearish while below 26,170, though strong tech earnings could trigger short-term upside volatility.

NAS100 Head and Shoulders and Gap If I am correct, and that is an M15 TF head and shoulders pattern then we might finally see a fill of that gap.

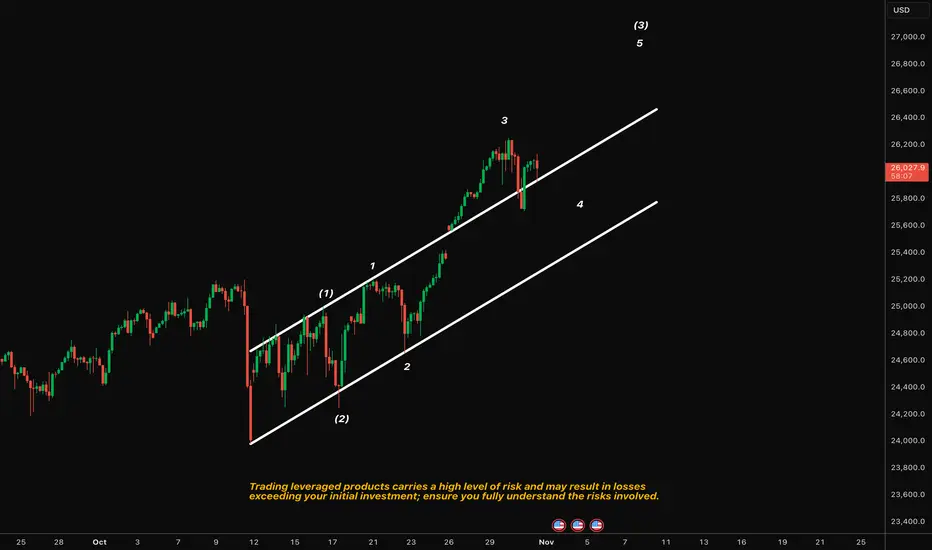
NASDAQ100 | Wave 4 Correction Within ChannelPrice has respected a clean ascending channel, completing a clear 1–2–3 wave sequence. We’re now seeing a corrective pullback that aligns with the wave 4 region — testing the midline support of the channel. As long as this structure holds, the broader wave (3) remains intact.
Scenarios:
Scenario A: If the lower channel and wave 4 region hold → potential continuation higher toward wave 5 and the upper boundary near 26,600–26,800.
Scenario B: If the channel support breaks → deeper correction likely toward 25,800 before any potential resumption of trend.
Reversal From ATH, Momentum Turns Cautious Reversal From ATH, Momentum Turns Cautious
The NASDAQ reversed from its all-time high and remains below 26,175, signaling short-term bearish momentum.
➡️ Below 26,175: Bearish bias toward 25,890 → 25,700 → 25,340.
➡️ Above 26,245: Bullish continuation toward 26,500 → 26,850.
Pivot POINT: 26,175
Support: 25,890 · 25,700 · 25,340
Resistance: 26,500 · 26,850 · 27,000
USNAS100 remains bearish while below 26,175, but a 1H close above 26,245 would confirm a bullish breakout toward higher targets.
Nasdaq Holds Below the 26,300-ResistanceHaving broken above the 26,000 mark, the Nasdaq has also moved beyond the upper boundary of a channel respected since July 2025, now trading within the duplicated (parallel) channel structure.
The mid-zone of this duplicated channel represents initial resistance near 26,300, and a confirmed breakout above this level could extend gains toward the upper boundary near 26,800.
On the downside, a move back below 25,700 could trigger a sharper pullback toward 25,400, with additional support near 25,200. The daily RSI continues to diverge negatively from price action, signaling caution near current record highs.
Written by Razan Hilal, CMT

US100 REBOUND AHEAD|LONG|
✅US100 is approaching a defined demand level where discount pricing aligns with bullish order flow. A potential rebound may deliver price toward the imbalance above. Time Frame 5H.
LONG🚀
✅Like and subscribe to never miss a new idea!✅

US100 Buy Trade within RangeUS100 has bounced back from its support and is now going to test the resistance. We can take a 1:1 long setup within this range.
Institutional Zones Marked – Key Levels for Today 13 NovSharing the key price areas where the market previously showed strong institutional activity.
These levels highlight zones of interest based on structure, volume presence, and reaction points.
The chart marks:
• Potential buying zones
• Potential selling zones
• Reaction areas where liquidity was taken or mitigated
This is shared for market study and educational observation.
Price may react differently depending on volatility and session behaviour — always wait for confirmation from structure.
Not financial advice.

Trendline Break and double bottom The price has broken out of a bearish trendline followed by 2 pullbacks that formed a double bottom pattern and now the price looks to make a higher high and continue long
WE ONLY TRADE PULLBACKS
Comment your thoughts
USTEC - Shorts - In the money!!!!🔥 USTE/15 — Morning Sell Trades Explained (Who Caught These With Us?)
This morning our system printed two clean SELL signals — both highlighted on the chart.
📉 Sell #1 — Momentum Flush
Price tapped into a short-term premium zone and immediately rejected.
Our system triggered the orange SELL candle right at the top of the move.
Within minutes, momentum collapsed and delivered a clean downside push.
📉 Sell #2 — Premium Retrace + Rejection
After the first drop, price pulled back into our sell zone again.
The system flagged a second SELL opportunity (again marked in orange).
The rejection was instant — textbook continuation setup.
Both entries respected the exact rules of the system:
✔️ Trend alignment
✔️ Premium pricing
✔️ Momentum shift
✔️ Clear rejection candle
No guessing. No emotion. Just execution.
💬 Who caught these sells with us today?
Drop a comment below if you took the trades — or if you’re testing the system and saw the same signals!

NASDAQ NAS100 Under Pressure – Watching for a Break of StructureThe NASDAQ is currently showing signs of weakness on the 4-hour chart. Sellers are gradually stepping in, and we can see US100 bearish momentum starting to take control. The market is under pressure, and price action is hinting at potential continuation to the downside.
I’ll be watching closely for a NAS100 break below the current range low — if price retests that level and fails to reclaim it, that would confirm a bearish market structure shift 🔻. Such a setup could provide a high-probability short opportunity as momentum accelerates to the downside.
⚠️ This is not financial advice — purely for educational and analytical purposes.

NASDAQ IS BEARIcHcheck out this , on the higher time frame the price seems to be bearish and the market couldn't puch higher than the previous Lower high , so we expect the market to rebalance after grabbing enough liquidity

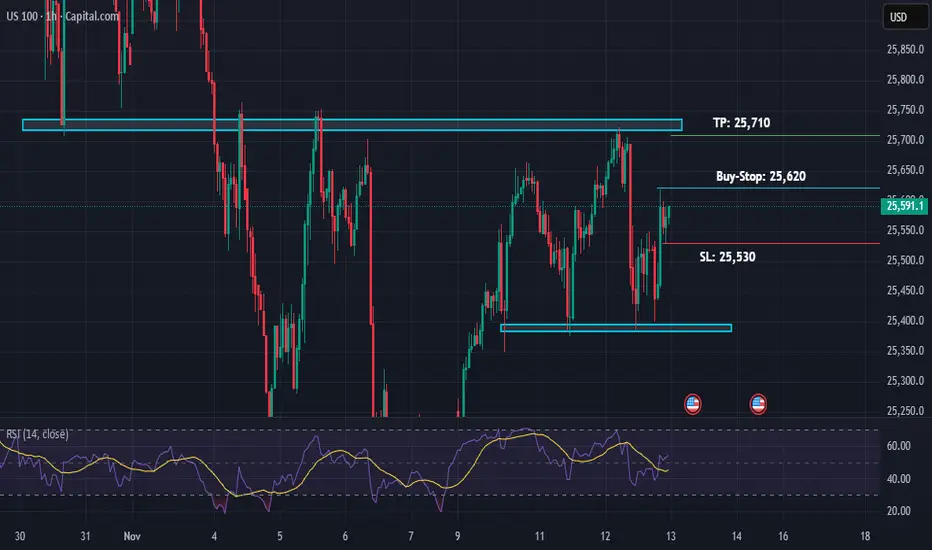
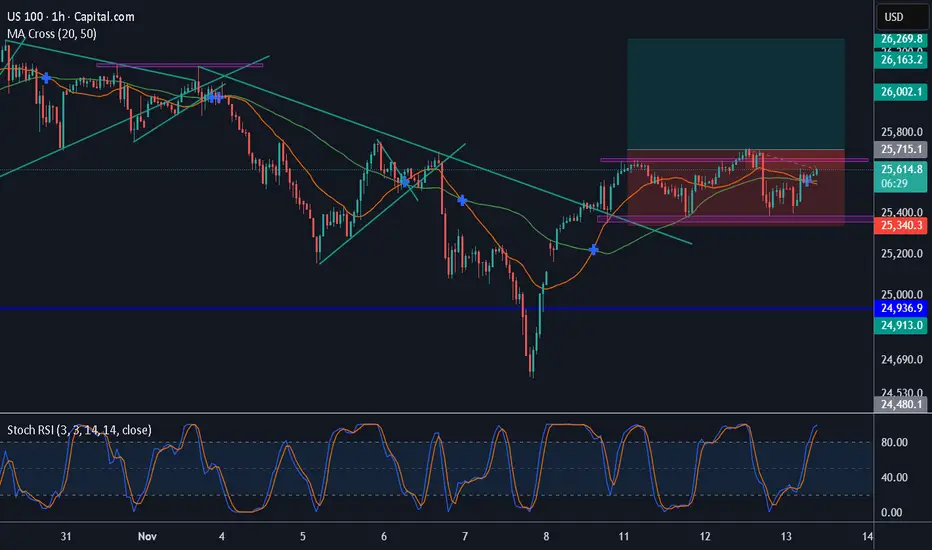
NAS100: Threshold Analysis & Decision FrameworkNAS100: Threshold Analysis & Decision Framework | November 12
Reference Point: 25,625 | 08:45 UTC+4
MARKET PREMISE
The Nasdaq 100 has stabilized within a confined bandwidth, presenting traders with a defined set of bifurcated outcomes. The micro-structure reveals a market in the midst of accumulation, where directional bias remains contested between competing institutional flows.
TECHNICAL ASSESSMENT MATRIX
Primary Trend (Dow Theory Lens): Uptrend remains intact; lower-bound support at 25,500 preserves bullish structure. Failure to maintain this floor signals potential regime shift.
Pattern Development: A Symmetrical Triangle is in formation across the 1H/4H timeframes. Contraction suggests breakout imminent—directional confirmation required.
Elliott Wave Interpretation: Wave IV consolidation underway. Upon completion, Wave V upleg anticipated toward fresh resistance territories.
Harmonic Configuration: Potential bearish Bat pattern exists if price recedes; conversely, completion of bullish Crab pattern supports upside continuation above 25,750.
INDICATOR CONFLUENCE TABLE
| Indicator | Timeframe | Status | Signal |
|-----------|-----------|--------|--------|
| Ichimoku Kumo | 4H | Price-Kumo Contact | Neutral-to-Bullish |
| RSI(14) | 4H | ~50 Median | Energy Stored |
| VWAP Proximity | Intraday | At Fair Value | Equilibrium |
| EMA(50) Stack | 1H | Bullish Alignment | Support Intact |
| Bollinger Squeeze | 30M | Band Tightening | Volatility Expansion Pending |
OPERATIONAL TRADE MATRIX
Bullish Engagement (Primary):
- Activation: Hourly close above 25,700 (Triangle apex breakout)
- Entry Coordination: 25,720–25,750
- Protective Stop: 25,580
- Profit Sequencing: 25,900 (T1) → 26,150 (T2)
- Risk-Reward Ratio: 1:2.4
Bearish Contingency (Secondary):
- Activation: Sustained close below 25,500 (Foundation breach)
- Entry Coordination: 25,480–25,450
- Protective Stop: 25,650
- Profit Sequencing: 25,250 (T1) → 25,000 (T2)
- Risk-Reward Ratio: 1:1.8
GANN TEMPORAL OVERLAY
Key cyclical windows on the 4D chart suggest consolidation resolution within the 12–15 hour window. Volume profile at the 25,650 level indicates potential liquidity pool; breakouts through this zone warrant heightened position management.
TRADE DIRECTIVE: Await breakout confirmation with concurrent volume expansion. Triangle compression suggests potential catalytic move. Disciplined position-sizing essential given binary outcome structure.