Giveaway 2025: Merry Christmas & Happy Holidays!Another year, another stack of charts, lessons learned the hard way, and moments where the market reminded us who’s really in charge.
As 2025 winds down, we want to say a genuine thank you. Your ideas, comments, chart screenshots, hot takes, and valuable feedback are what make TradingView what it i
About S&P 500 Index
Standard & Poor’s 500 is an American stock market index consisting of 500 large companies having common stock listed on the NYSE or NASDAQ and their market capitalizations. It captures approximately 80% coverage of available market capitalization. Because it includes both growth stocks and value stocks it is one of the most followed equity indices and is considered to be one of the best representations of the U.S. stock market and a trend indicator for the U.S. economy. S&P introduced its first index in 1923 and its present day form on March 4,1957. It was developed and continues to maintained by S&P Dow Jones Indices, a joint venture majority owned by McGraw Hill Financial.
Gold % Gain vs SPX Since 1971Debt wasn’t the problem in 1971 or 1980. It became the system after 2000.
In 1980, the U.S. owed ~30% of its GDP.
In 2000, ~55%. In 2025, ~125%.
This isn’t inflation theory. It’s arithmetic!
I have long been a critic of MMT (Modern Monetary Theory)
Or, as I like to call it more accurately, OC
S&P500 rejection can cause a very bearish start to 2026.The S&P500 index (SPX) hit last Friday its Higher Highs trend-line and got rejected, so far not aggressively.
The 1D RSI rejection though on a Lower Highs trend-line that goes as back as the September 22 High, illustrates a massive Bearish Divergence (Lower Highs against price's Higher Highs), has
S&P 500 Daily Structure: Rising Wedge & Rare RSI Divergence
This chart highlights a rising wedge formation developing after a strong uptrend
on the S&P 500 Daily timeframe.
Price structure continues to print higher highs and higher lows,
while the market compresses within a narrowing range.
What makes this structure particularly interesting is the presenc
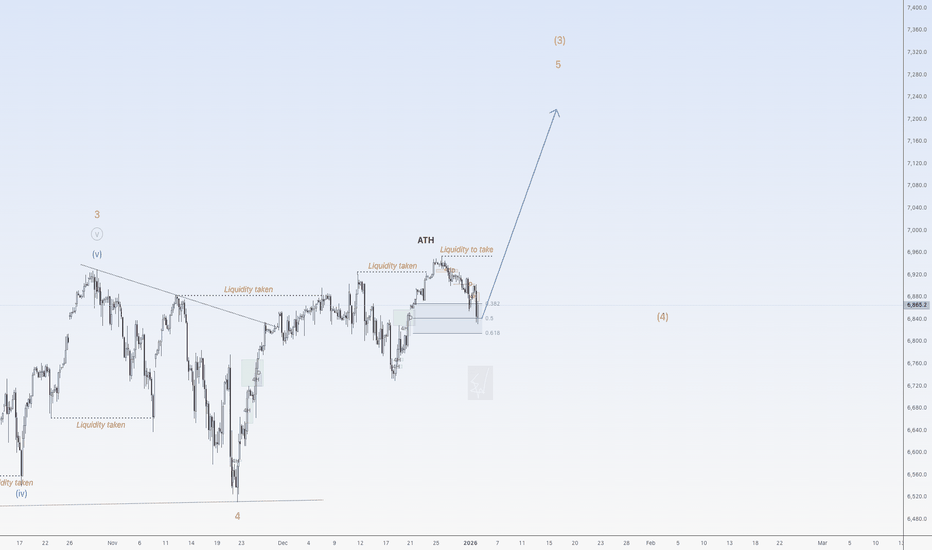
Hellena | SPX500 (4H): LONG to resistance area of 7010.Colleagues, I expect the upward movement in the medium-term wave “1” to continue.
The minor wave “3” should still be developing, and I expect a repeat update of the high of the higher-order wave “3” (6929.4).
I consider the 7010 area to be the nearest target. If we calculate using Fibonacci expansi
S&P 500 Index Approaches the 7,000-Point LevelOver the past five trading sessions, the U.S. equity index S&P 500 (SPX) has maintained a consistent bullish bias, posting gains of more than 2% in the short term and moving closer to the psychological 7,000-point level. For now, the index has managed to sustain firm buying pressure, supported by op
The S&P 500 Index Trades Near Its All-Time HighThe S&P 500 Index Trades Near Its All-Time High
As indicated by the S&P 500 index chart:
→ After breaking above the resistance line (shown in red) in the third week of December, the equity market formed an upward trend, consistent with the typical characteristics of the Santa Claus Rally.
→ At t
S&P500 could go up nowHi traders,
I wish you health, wealth and wisdom for 2026. Let's go!
Last week SPX500USD made a correction down just as I've said.
Price came into the bullish Daily FVG and rejected from there. So next week we could see more upside again for this pair.
Let's see what the market does and react.
See all ideas
Displays a symbol's value movements over previous years to identify recurring trends.
Frequently Asked Questions
S&P 500 Index reached its highest quote on Dec 26, 2025 — 6,945.1 USD. See more data on the S&P 500 Index chart.
The lowest ever quote of S&P 500 Index is 665.6 USD. It was reached on Mar 6, 2009. See more data on the S&P 500 Index chart.
S&P 500 Index is just a number that lets you track performance of the instruments comprising the index, so you can't invest in it directly. But you can buy S&P 500 Index futures or funds or invest in its components.


