IC2 trade ideas


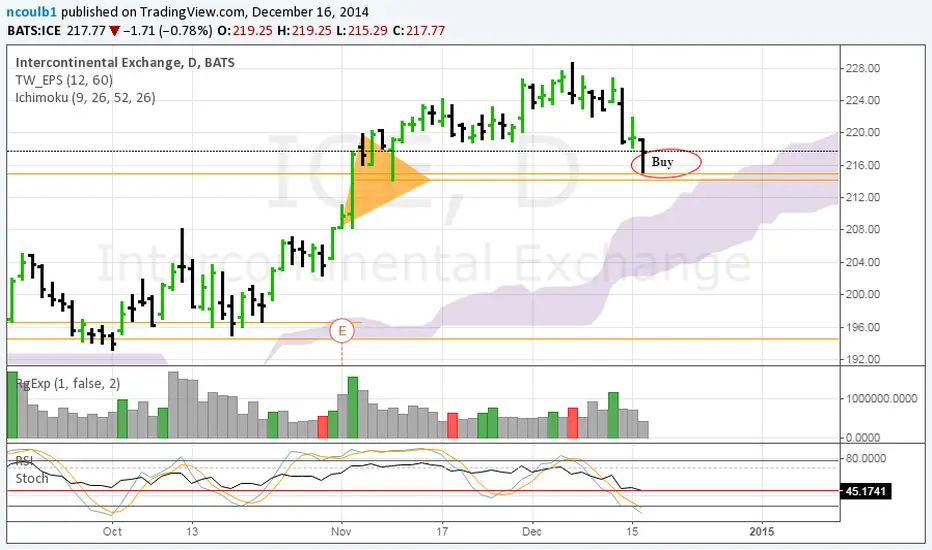
ICE approaching multiple key hidden levelsAnalysis on chart, expect another touch of earnings levels before any sustainable upward action can ensue (current move off this level is corrective)
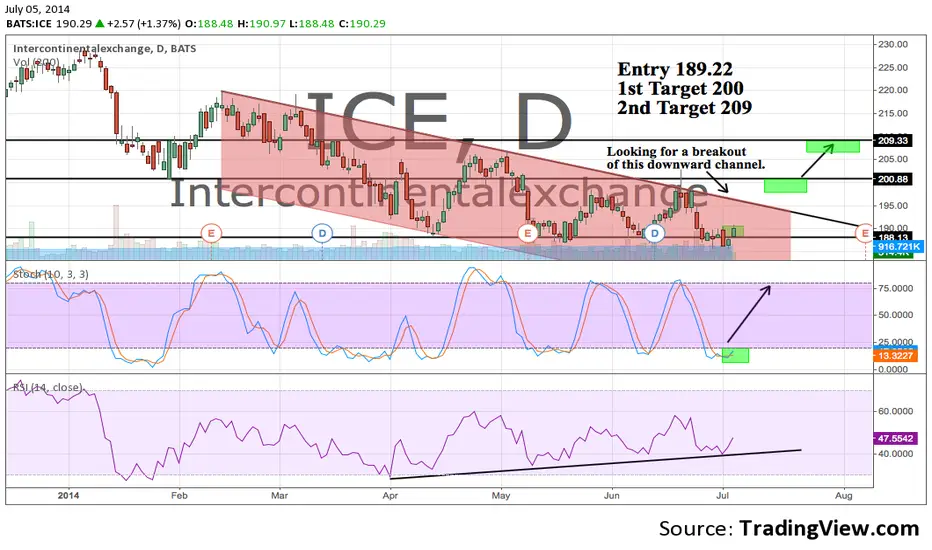
Good shorting opportunityICE - has been treading at the lower part of the downtrend channel since april, it started its explosive move Sept onwards. After making a high, it retreated and attempted a higher high. At closed yesterday, it ended with a Big DOJI which is skew lower than the mid point. With MACD and RSi giving signal (though not formed yet) bearish divergence and price are nearing the top of the channel, there is a good chance that ICE will join the next sell off.
With a price of 200000 in 1 lot size, the plunge can carry some weight to affect the major indices.
If the entire market trend is in bad shape, shorting will give higher chance of success if all price pattern, chart pattern and indicator give a bearish signal.
This is expensive stock. So i can only use a put options at strike price around 200 but waiting for price to get as close as 205-207 so that i can buy my put options cheaper.
P.S. The Sept high is around 205, it tested once but failed. I anticipate another test and thats when i launch my attack

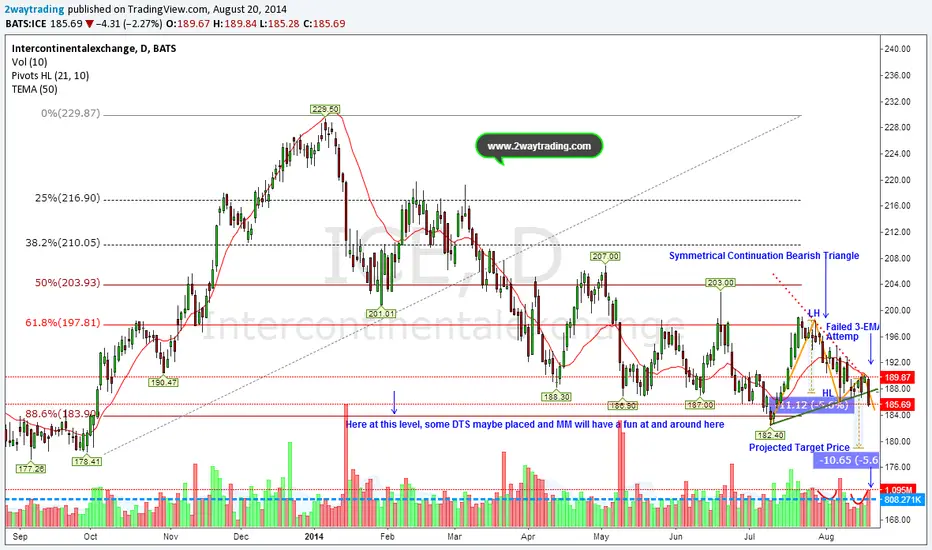
Symmetrical Continuation Bearish Triangle It looks the price has broken downward out of a consolidation period, suggesting a continuation of the June downtrend. A Symmetrical Continuation Triangle (Bearish) shows two converging trendlines as prices reach lower highs and higher lows. Volume diminishes as the price swings back and forth between an increasingly narrow range reflecting uncertainty in the market direction. Then well before the triangle reaches its apex, the price breaks down below the lower trendline with a noticeable increase in volume as shown the blue arrow on the last volume column, confirming the pattern as a continuation of the prior downtrend