ZZA trade ideas

$CNK look for this to hold above the down trend line of the flag pattern. profit goal would be around the 1.618 fib ext $20 also some resistance at the $16 mark watch this for for any trouble this could be a good spot to take some profit as well .with a stop lose of the support level in the flag . stay safe and happy trading

Supply & Demand Trading Analysis 11/22/2020With the strong bullish momentum dissipating, the signs of a reemergence of mass hysteria with wave 2 of covid arriving, numerous stocks a far distance away from major moving averages, big institutions adding more hedges to their portfolio's, these stories appear to ring the same tune prior to the crash in march. With a majority of stocks failing to reach new highs or inside supply zones, here are some stocks showing signs that a reversal to the downside is imminent.
MU
- A strong trend to the upside, however volume appears to diverge with price, a textbook bearish signal.
- Inside a major daily supply zone + strong rejection attempting to break above zone.
- Far distance away from 20ema on daily chart. Pullbacks resulted every time during similar prior occurrences.
- Entering a short position if price begins to break lower level of daily supply (59.44)
BIDU
- Price recently bounces of 200ema while inside a monthly demand zone.
- Price is showing consolidation, preparing for another strong move to either side.
- Looking to BTFD if price drops back to 200ema within the monthly demand zone.
MS
- A market top appears to have formed a market top on daily chart after failing to break above supply zones
- Will enter short position if price breaks below $57. Strong indication price is reversing.
- A triple top appears to have formed when analyzing weekly chart.
- A sharp rise in price with decreasing volume and far distance away from ema's = perfect pullback conditions
KSS
- Keeping an eye on how price moves this week as it appears to be forming a bull flag while attempting break above daily supply zone.
- If price moves in predicted pattern, will enter a short position as price enters circled zone. Black trendline is the top of monthly downtrend, expecting a rejection as price approaches.
PYPL
- Price in consolidation in middle of a 4 month trading range. With market conditions showing signs of a market ready to sell, I expect a breakout on the downside.
- Will look to BTFD if price breakouts out, entering demand zone along with 200ema inside zone resulting in high possibility price will use 200ema as support.
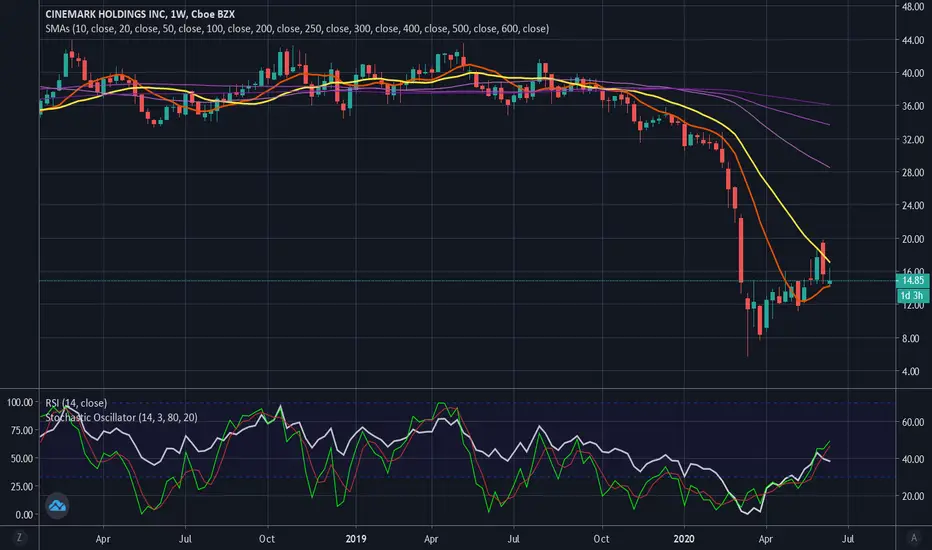
CNK
- Price rejects off 200ema after touching ema for the first time in 2020.
- If price begins to rise back into weekly supply zone AND with decreasing volume, will enter a short position in circled zone as it tests both a major supply zone and 200ema resistance.

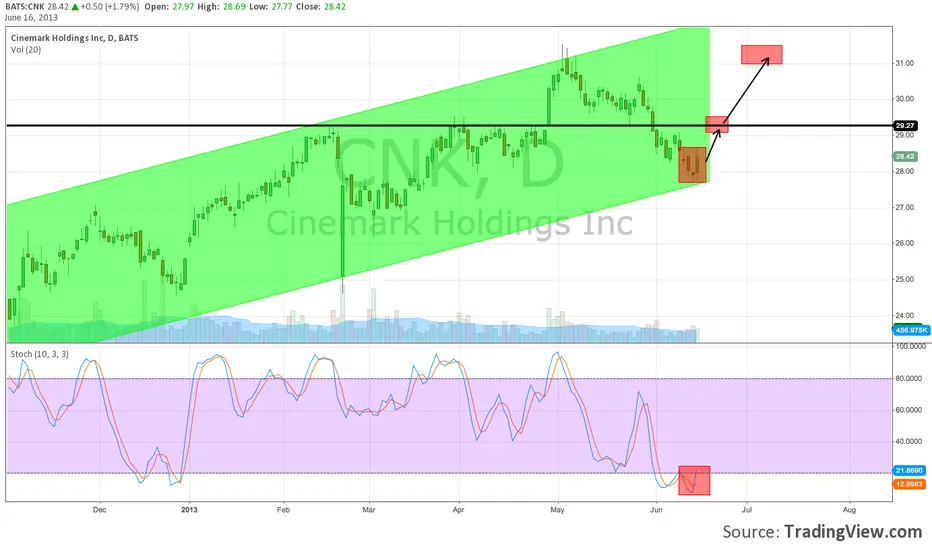
$CNK Cinemark Holdings Inc Potential Trendline Breakout
Downtrend has been broken pre-market a back test at the open would be bullish.
Potential targets-
$15.00 Monthly candle resistance
$16.05 Fibonacci 0.382 level.
Volatile news related stock


CNK - nice reward to risk if stock moves upYou can buy 100 shares for $1490, or you can control 500 shares for $978. I bought Sept 2020, 20 strike calls.
I will exit if stock goes below $14.

CNK - Channel turned into Ascending TriangleWill look to enter around 15 with targets marked above if it can confirm the break out. If not, levels are easily seen as well for a breakdown. Again, keep an eye on that cloud creation on the right.

Cinemark - At Bottom of Rising Wedge - Buying OpportunityMay/June calls anyone? Sell at the top of the wedge!!

CNK: I Like It Long Term But Sell Signal NowHitting the resistance with the Trump pump yesterday. Will need to fill the gap. Take profits.
*I trade based on 1) Opportunity, 2) Fundamentals, 3) Chart Trends, and 4) Pure Luck. Follow me and Let's Win Some Money Together.

CNK SHORT TRADECNK is on a clear downtrend both on the daily chart and the weekly chart
Price has formed a bearish pinbar with higher volume than average which could be an indication of further downside
Hence we want to sell this stock
We don't want to be greedy so i am looking for a 1/1.5 risk to reward on this trade
My SL is placed above the high of the last 5 candles
Only buy if the price breaks the low of the last candle

CINEMARK 1D TRIANGLE TRADESTriangles, Descending Triangles, Ascending Triangle and Ranges are repeatable trading chart patterns.
Triangles and ranges are consolidation chart patterns that can breakout either direction.
Ascending and descending chart patterns will have a directional bias depending on the previous incoming trend.
Each chart pattern will have defining trendlines of the support/resistance levels creating the pattern.
What ever time frame you are trading this chart pattern, wait for a candle close outside of the trendline in the direction of the breakout candle. (Our time frame preference is the Daily chart).
Add volume indicator - Volume is the amount of $ that went into a particular candle or in Forex the # of trades that took place.
Add ATR indicator - Volatility is the amount of price movement that occurred. Use the ATR to measure the price movement.
When you see descending Volume bars and descending ATR line (which indicates volatility) this shows
a dis-interest in traders to invest in this pair creating consolidation which creates the chart pattern.
Trade Management after there is a breakout candle close.
1 - Position size (compare volume bar to volume ma line).
a - Breakout candle must be 100% of average volume for a full position size.
b - If 75% of average volume then ½ position size. (To find 75% of Volume
look at the charts volume settings – divide smaller # into larger # = 75%+)
2 - Enter two trades.
3 - SL for both trades will be 1.5 x ATR.
4 - 1st trade TP will be 1 x ATR.
5 - No TP on 2nd trade – letting profit run and adjusting SL to follow price.
6 - When 1st TP hit – move 2nd trade SL to breakeven.
7 - Adjust the 2nd trade SL to follow price.
*8 – After Breakout candle – if price closes back into chart pattern close trade
*9 - When breakout candle is more than 1 ATR from breakout candle open.
a - Enter 1st trade at candle close with ½ position size.
b - Enter 2nd trade with a pending limit order that is 1 ATR of breakout candle open.
c – Price should pullback to that pending limit order for 2nd trade.
d – If Price returns back into chart pattern close trade before SL is hit.


CNK Bearish Bat & CrabBearish bat on the weekly and bearish crab on the daily. Both pattern have very good measurements, and we are also seeing bearish divergence on the crab pattern.

$CNK are movie theaters time a thing of the past?$CNK are movie theaters time a thing of the past like the drive inns, Barron's 4 or 5 months ago published a neutral to bearish article, I wonder what will be the future of them. $ROKU is the future.