Galp strengthens its Iberian strategy with MoeveIon Jauregui - Analyst at ActivTrades
Galp Energia has taken a significant strategic step by reaching a non-binding agreement with Moeve to integrate their downstream businesses in the Iberian Peninsula. The transaction, which aims to create two platforms with European scale —IndustrialCo and Retai
Galp Energia, SA
No trades
Next report date
—
Report period
—
EPS estimate
—
Revenue estimate
—
1.54 USD
1.08 B USD
22.06 B USD
414.89 M
About Galp Energia, SGPS S.A. Class B
Sector
Industry
Website
Headquarters
Lisbon
Founded
1999
IPO date
Oct 23, 2006
Identifiers
2
ISIN PTGAL0AM0009
Galp Energia SGPS SA engages in the exploration and production of oil and gas. It operates through the following segments: Upstream; Refining and Midstream; Commercial; and Renewables and New Businesses. The Upstream segment includes exploration, development, and production of hydrocarbons, mainly focused on Brazil, Mozambique, and Angola. The Refining and Midstream segment owns refineries in Portugal, and also includes all activities relating to the wholesale marketing of oil products, gas, and electricity. The Commercial segment encompasses the area of retail to final customers of oil, gas, and electricity. The Renewables and New Businesses segment covers Galp's presence in the renewable energies industry. The company was founded on April 22, 1999 and is headquartered in Lisbon, Portugal.
Related stocks

Galp energia Galp is a company with a market capitalization of around €12.5 billion, a well-established Portuguese energy firm listed in Lisbon.
Galp holds a diverse portfolio of assets in both traditional energy and renewable energy sectors.
Of course, everyone should conduct their own independent research rega

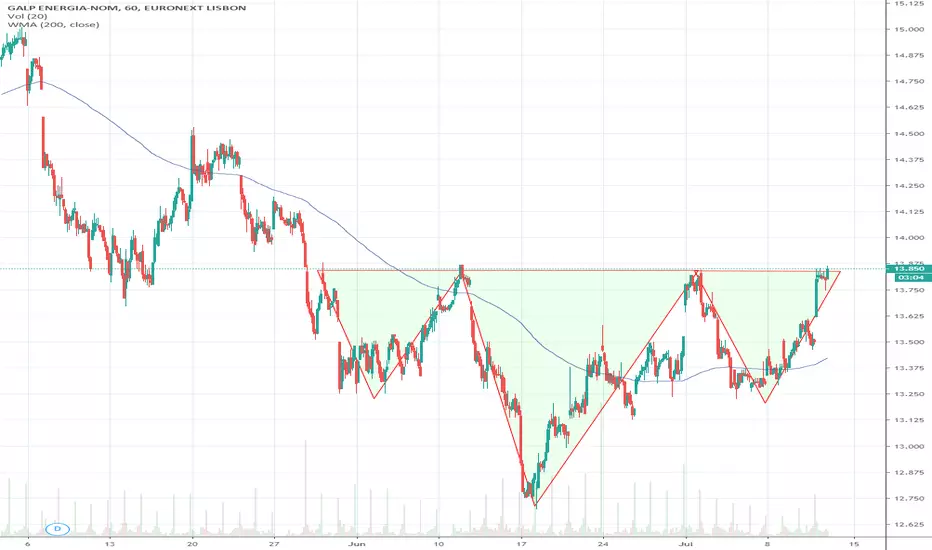
$GALP.LS #GALP buy signals!$GALP.LS #GALP had buy signals within #bullflag correction. Corrected to 20d EMA as expected and, once 19.50 resistance was overcome, the sky was the limit. If it passes 20.00, 21.00 is likely!

Added to my existing $GALP GALP long positionAdded to my existing postion on GALP $GALP.
Timeframe: 4H
Target: ~€15
SL: ~ €14.23
Reason: trend continuation on 4H. Trend on daily chart is bullish and strong


See all ideas
Summarizing what the indicators are suggesting.
Neutral
SellBuy
Strong sellStrong buy
Strong sellSellNeutralBuyStrong buy
Neutral
SellBuy
Strong sellStrong buy
Strong sellSellNeutralBuyStrong buy
Neutral
SellBuy
Strong sellStrong buy
Strong sellSellNeutralBuyStrong buy
An aggregate view of professional's ratings.
Neutral
SellBuy
Strong sellStrong buy
Strong sellSellNeutralBuyStrong buy
Neutral
SellBuy
Strong sellStrong buy
Strong sellSellNeutralBuyStrong buy
Neutral
SellBuy
Strong sellStrong buy
Strong sellSellNeutralBuyStrong buy
Displays a symbol's price movements over previous years to identify recurring trends.
WPEH
iShares VI PLC - iShares MSCI World Swap PEA UCITS ETF AccumHedged EURWeight
2.70%
Market value
35.22 M
USD
EWLD
Amundi Index Solutions SICAV - Amundi MSCI World Swap UCITS ETFWeight
0.40%
Market value
28.44 M
USD
Explore more ETFs
Frequently Asked Questions
The current price of GLPEF is 21.72 USD — it has increased by 2.43% in the past 24 hours. Watch Galp Energia, SA stock price performance more closely on the chart.
Depending on the exchange, the stock ticker may vary. For instance, on OTC exchange Galp Energia, SA stocks are traded under the ticker GLPEF.
GLPEF stock has risen by 3.18% compared to the previous week, the month change is a 23.38% rise, over the last year Galp Energia, SA has showed a 30.42% increase.
We've gathered analysts' opinions on Galp Energia, SA future price: according to them, GLPEF price has a max estimate of 27.18 USD and a min estimate of 14.42 USD. Watch GLPEF chart and read a more detailed Galp Energia, SA stock forecast: see what analysts think of Galp Energia, SA and suggest that you do with its stocks.
GLPEF reached its all-time high on Dec 27, 2007 with the price of 28.00 USD, and its all-time low was 1.55 USD and was reached on Sep 26, 2008. View more price dynamics on GLPEF chart.
See other stocks reaching their highest and lowest prices.
See other stocks reaching their highest and lowest prices.
GLPEF stock is 2.37% volatile and has beta coefficient of 1.73. Track Galp Energia, SA stock price on the chart and check out the list of the most volatile stocks — is Galp Energia, SA there?
Today Galp Energia, SA has the market capitalization of 15.82 B, it has increased by 4.61% over the last week.
Yes, you can track Galp Energia, SA financials in yearly and quarterly reports right on TradingView.
Galp Energia, SA is going to release the next earnings report on Mar 2, 2026. Keep track of upcoming events with our Earnings Calendar.
GLPEF earnings for the last quarter are 0.63 USD per share, whereas the estimation was 0.49 USD resulting in a 28.90% surprise. The estimated earnings for the next quarter are 0.23 USD per share. See more details about Galp Energia, SA earnings.
Galp Energia, SA revenue for the last quarter amounts to 5.84 B USD, despite the estimated figure of 5.93 B USD. In the next quarter, revenue is expected to reach 4.19 B USD.
GLPEF net income for the last quarter is 309.79 M USD, while the quarter before that showed 371.07 M USD of net income which accounts for −16.51% change. Track more Galp Energia, SA financial stats to get the full picture.
Galp Energia, SA dividend yield was 3.89% in 2024, and payout ratio reached 45.36%. The year before the numbers were 4.05% and 33.61% correspondingly. See high-dividend stocks and find more opportunities for your portfolio.
As of Feb 14, 2026, the company has 7.09 K employees. See our rating of the largest employees — is Galp Energia, SA on this list?
EBITDA measures a company's operating performance, its growth signifies an improvement in the efficiency of a company. Galp Energia, SA EBITDA is 2.80 B USD, and current EBITDA margin is 14.60%. See more stats in Galp Energia, SA financial statements.
Like other stocks, GLPEF shares are traded on stock exchanges, e.g. Nasdaq, Nyse, Euronext, and the easiest way to buy them is through an online stock broker. To do this, you need to open an account and follow a broker's procedures, then start trading. You can trade Galp Energia, SA stock right from TradingView charts — choose your broker and connect to your account.
Investing in stocks requires a comprehensive research: you should carefully study all the available data, e.g. company's financials, related news, and its technical analysis. So Galp Energia, SA technincal analysis shows the strong buy rating today, and its 1 week rating is strong buy. Since market conditions are prone to changes, it's worth looking a bit further into the future — according to the 1 month rating Galp Energia, SA stock shows the strong buy signal. See more of Galp Energia, SA technicals for a more comprehensive analysis.
If you're still not sure, try looking for inspiration in our curated watchlists.
If you're still not sure, try looking for inspiration in our curated watchlists.