GRAB Holdings Options Ahead of EarningsIf you haven`t bought the dip on GRAB:
Now analyzing the options chain and the chart patterns of GRAB Holdings prior to the earnings report,
I would consider purchasing the 7usd strike price in the money Calls with
an expiration date of 2028-1-21,
for a premium of approximately $0.73.
If these opt
Grab Holdings Limited
No trades
Key facts today
Next report date
—
Report period
—
EPS estimate
—
Revenue estimate
—
0.03 USD
−105.00 M USD
2.80 B USD
2.49 B
About Grab Holdings Limited
Sector
Industry
CEO
Ping Yeow Tan
Website
Headquarters
Singapore
Founded
2012
IPO date
Oct 1, 2020
Identifiers
3
ISIN KYG4124C1096
Grab Holdings Ltd. engages in the provision of millions of people each day to access its driver- and merchant-partners to order food or groceries, send packages, hail a ride or taxi, pay for online purchases or access services such as lending, insurance, wealth management and telemedicine, all through a single “everyday everything” app. The firm operates in food deliveries and mobility and by TPV in the e-wallets segment of financial services in Southeast Asia. It operates across the deliveries, mobility and digital financial services sectors in eight countries namely: Cambodia, Indonesia, Malaysia, Myanmar, the Philippines, Singapore, Thailand and Vietnam. The company was founded by Anthony Tan Ping Yeow and Tan Hooi Ling in 2012 and is headquartered in Singapore.
Related stocks

GRAB: Time Horizon Arbitrage1. Executive Summary: The Great Disconnect
Investors are currently staring at two completely different realities.
Grab just posted its best year in history, hitting its first-ever full-year profit and launching a massive buyback. The business is fundamentally stronger than it has ever been.
The ch

It's a time for GRAB - 35% potential profit - 6.40 $On the daily chart of Grab Holdings Limited (GRAB), the price action suggests conditions favorable for a short-term bullish rebound. Following a sharp decline, the price has reached a strong support zone around 4.60–4.80 USD, an area that previously attracted buying interest multiple times. This zon

GRAB Holdings Options Ahead of EarningsIf you missed buying GRAB before the rally:
Now analyzing the options chain and the chart patterns of GRAB Holdings prior to the earnings report,
I would consider purchasing the 7usd strike price in the money Calls with
an expiration date of 2028-1-21,
for a premium of approximately $0.84.
If thes

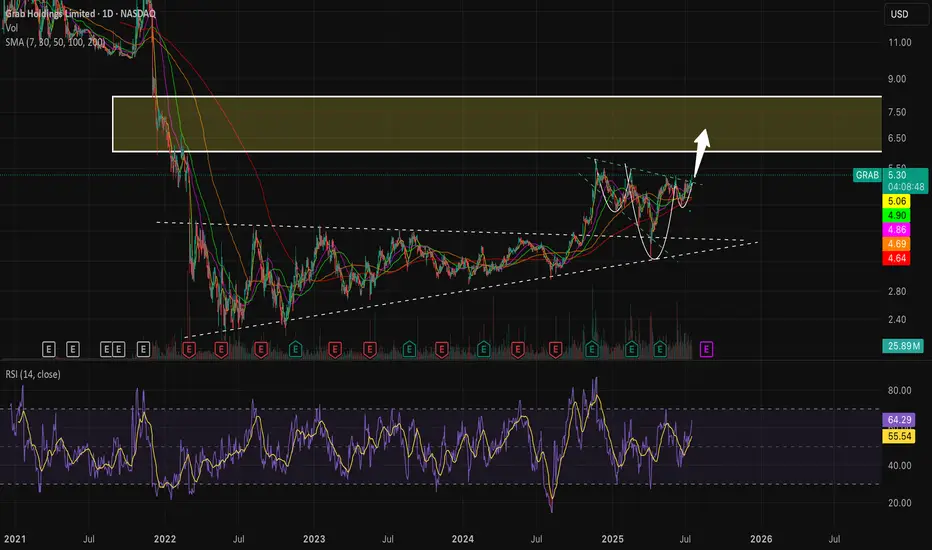
$GRAB ready for the launch to $6-8 range- NASDAQ:GRAB market leader in south east asia with diversified business in a growing economy has massive TAM and strong tailwinds i.e economy of scale.
- it provides you to diversify your portfolio with emerging markets.
- NASDAQ:GRAB was consolidating and now is ready for the impulsive move to
Grab Holdings Ltd (GRAB) – Macro Reversal Setup (3D Timeframe)hi traders
This technical analysis evaluates the 3-day (3D) chart of GRAB, identifying a potential long-term trend reversal following a significant period of accumulation at historical lows.
1. Technical Setup: The Structural Bottom
Since its peak, GRAB has undergone a massive correction and has

$GRAB , SetupEntry : CMP
TP1 : 5.3
TP2 : 13.82
TP3 : 28.35
SL : If you wish
Follow, Boost, Thank you
⚠️ Financial Disclaimer:
This post is not financial advice. I am not your financial advisor, your life coach, or your legally responsible adult.
Always do your own research and never trade based solely on int

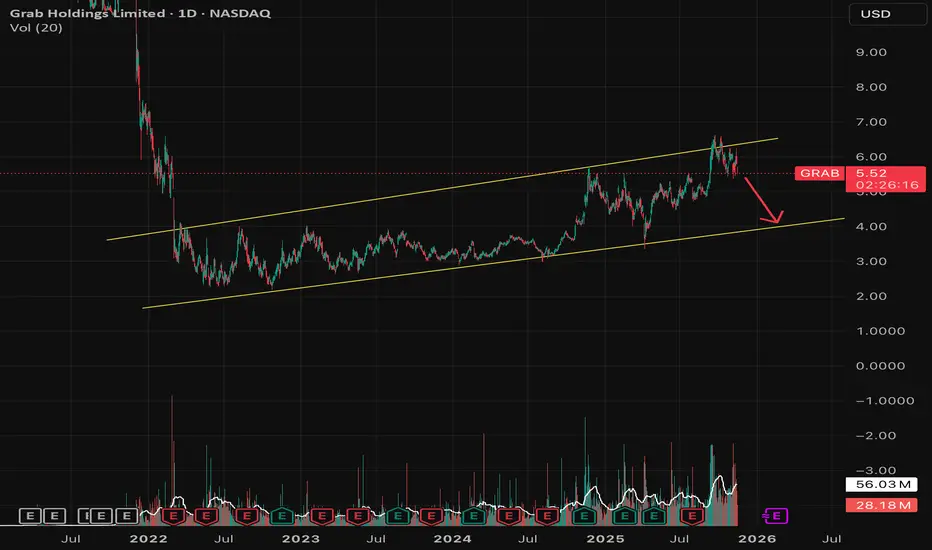
$GRAB time to test bottom of the channel- I alerted NASDAQ:GRAB before the breakout.
- Now, I am alerting people to be cautious of the sell off and re-testing of the bottom of the trendline.
- NASDAQ:GRAB should go to range of $4-4.5 and test the trend line
Grab holdingsNASDAQ:GRAB
- Holding the monthly 0.382 retracement
- Backtested the Tenkan
- Sellers getting exausted
- Institutions buying
I smell money.

GRAB...whilst the going's good?GRAB - The 'UBER' (and some) of Cambodia, Indonesia, Malaysia, Myanmar, the Philippines, Singapore, Thailand and Vietnam...After 2 consecutive PB quarters, GRAB could be shaping up for a successful couple years ahead.
Our systems have identified a point of potential interest & volatility in $NASDA

See all ideas
Summarizing what the indicators are suggesting.
Neutral
SellBuy
Strong sellStrong buy
Strong sellSellNeutralBuyStrong buy
Neutral
SellBuy
Strong sellStrong buy
Strong sellSellNeutralBuyStrong buy
Neutral
SellBuy
Strong sellStrong buy
Strong sellSellNeutralBuyStrong buy
An aggregate view of professional's ratings.
Neutral
SellBuy
Strong sellStrong buy
Strong sellSellNeutralBuyStrong buy
Neutral
SellBuy
Strong sellStrong buy
Strong sellSellNeutralBuyStrong buy
Neutral
SellBuy
Strong sellStrong buy
Strong sellSellNeutralBuyStrong buy
Displays a symbol's price movements over previous years to identify recurring trends.
Frequently Asked Questions
The current price of GRAB is 4.27 USD — it has decreased by −1.86% in the past 24 hours. Watch Grab Holdings Limited stock price performance more closely on the chart.
Depending on the exchange, the stock ticker may vary. For instance, on NASDAQ exchange Grab Holdings Limited stocks are traded under the ticker GRAB.
GRAB stock has fallen by −2.31% compared to the previous week, the month change is a −12.78% fall, over the last year Grab Holdings Limited has showed a −10.11% decrease.
We've gathered analysts' opinions on Grab Holdings Limited future price: according to them, GRAB price has a max estimate of 8.00 USD and a min estimate of 5.80 USD. Watch GRAB chart and read a more detailed Grab Holdings Limited stock forecast: see what analysts think of Grab Holdings Limited and suggest that you do with its stocks.
GRAB reached its all-time high on Jan 22, 2021 with the price of 18.11 USD, and its all-time low was 2.19 USD and was reached on Oct 24, 2022. View more price dynamics on GRAB chart.
See other stocks reaching their highest and lowest prices.
See other stocks reaching their highest and lowest prices.
GRAB stock is 6.90% volatile and has beta coefficient of 2.00. Track Grab Holdings Limited stock price on the chart and check out the list of the most volatile stocks — is Grab Holdings Limited there?
Today Grab Holdings Limited has the market capitalization of 17.28 B, it has decreased by −0.23% over the last week.
Yes, you can track Grab Holdings Limited financials in yearly and quarterly reports right on TradingView.
Grab Holdings Limited is going to release the next earnings report on May 14, 2026. Keep track of upcoming events with our Earnings Calendar.
GRAB earnings for the last quarter are 0.04 USD per share, whereas the estimation was 0.01 USD resulting in a 187.19% surprise. The estimated earnings for the next quarter are 0.02 USD per share. See more details about Grab Holdings Limited earnings.
Grab Holdings Limited revenue for the last quarter amounts to 906.00 M USD, despite the estimated figure of 936.59 M USD. In the next quarter, revenue is expected to reach 908.17 M USD.
GRAB net income for the last quarter is 171.00 M USD, while the quarter before that showed 37.00 M USD of net income which accounts for 362.16% change. Track more Grab Holdings Limited financial stats to get the full picture.
No, GRAB doesn't pay any dividends to its shareholders. But don't worry, we've prepared a list of high-dividend stocks for you.
EBITDA measures a company's operating performance, its growth signifies an improvement in the efficiency of a company. Grab Holdings Limited EBITDA is 390.00 M USD, and current EBITDA margin is 11.25%. See more stats in Grab Holdings Limited financial statements.
Like other stocks, GRAB shares are traded on stock exchanges, e.g. Nasdaq, Nyse, Euronext, and the easiest way to buy them is through an online stock broker. To do this, you need to open an account and follow a broker's procedures, then start trading. You can trade Grab Holdings Limited stock right from TradingView charts — choose your broker and connect to your account.
Investing in stocks requires a comprehensive research: you should carefully study all the available data, e.g. company's financials, related news, and its technical analysis. So Grab Holdings Limited technincal analysis shows the sell today, and its 1 week rating is sell. Since market conditions are prone to changes, it's worth looking a bit further into the future — according to the 1 month rating Grab Holdings Limited stock shows the sell signal. See more of Grab Holdings Limited technicals for a more comprehensive analysis.
If you're still not sure, try looking for inspiration in our curated watchlists.
If you're still not sure, try looking for inspiration in our curated watchlists.