Bearish GartleyBold assumption. I wanna say there's a trend reversal starting here with the whole acquisition of Saint Jude, but I trade patterns, not news.
ABL trade ideas

small deviation in the stock marketA beautiful bullish gartley, i have open my position at 38.62 t1 hit but i aspect 42.80 for the final target. half position closet at 38.2 fibo stop loss at breakeven.

Abbot Labsblack line:
simply ab=cd pattern
red line:
difficult to trade!!!
important is 37,61.
if the level triggered is ur take profit at 43,7
look there for a reversal!
green line:
difficult to trade but best crv!!!
important is also 37,61 and 36,1 but not 35,28
AND
if the level triggered above 43,7 is it going up to new higher highs
how to trade?
look for a gap or look at a nr7 bar at a smaller timeframe
Stopp Loss beyond 35,2 - moneymanagement is yours!
have fun

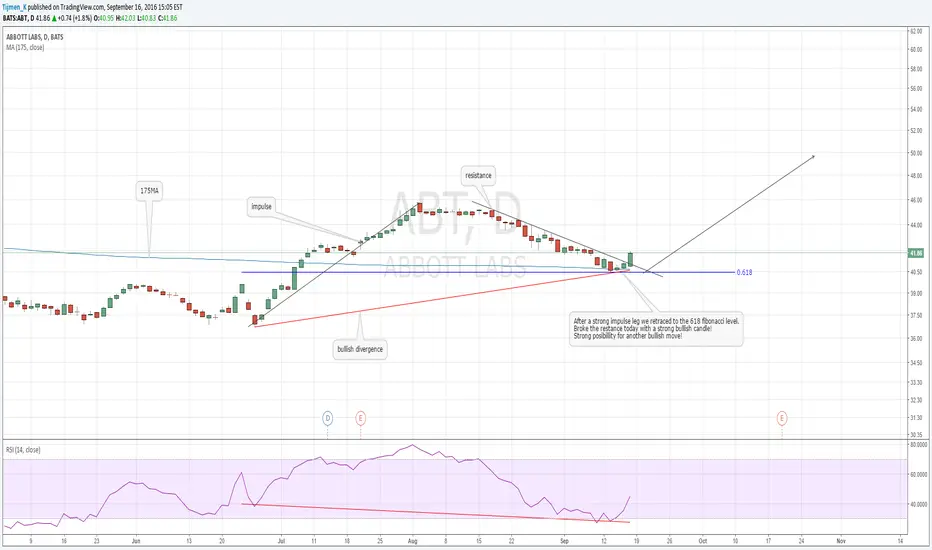
ABT Strong move expectedTraders,
Picked up this nice breakout.
We saw an very strong impulse followed by an retracement.
This could be a good move to the upside!
Best of luck
Previous resistance now support. Retest and fly.ABT recently broke the resistance of the down trend. It's coming down now to retest it (previous resistance which now is support). Probably should have waited until it will touch the trend line ($41-$42), but I got excited by the price meeting multiple EMAs and I initiated a long position at $42.


Abbot Labs - ABT - Monthly - What to expect when investingThat chart comments say it all:
You need to know that investments are far more volatile than what people discuss and far more than most people can handle because you need to expect to see big declines from time to time because that's just what happens. If you borrow money to buy stocks, you will take too much pressure and face liquidation by the margin department that loaned you the money to buy the stock. Look at all of the big percentage declines and also look at the fact that the dividend is now as great as the stock price was 45 years ago. Now that is compounding for the long term!
Tim
November 6, 2015 $45.18 last ABT, up from $0.30 in 1971


@jmolinaI'm honestly not sure what to think right now. We recently broke the neckline on a head and shoulder's pattern and we just broke the 200 MA. However, RSI is oversold and the wick stopped right at a resistance and just below the .618 fib line (I'm really not a fib expert). Since you are still in it, I think there is more downside back to 33.72, but then we may bounce a it before ultimately moving lower. Since I am not in, I don't think I'd take a position until we close below 33.65 and then I could see 31.11 being a realistic medium term target. I just think overall this chart isn't clear enough for me to take a position on. Any thoughts?
stocksncash.wordpress.com


Partial off at new highboth 60m and daily r OVERSOLD. This doesnt mean it wont go higher. I m just being cautious

Long ABTGet into long term trend
Confluence zone
Multiple cross of trendlines
Current point is catalyst point for continuation of trend
