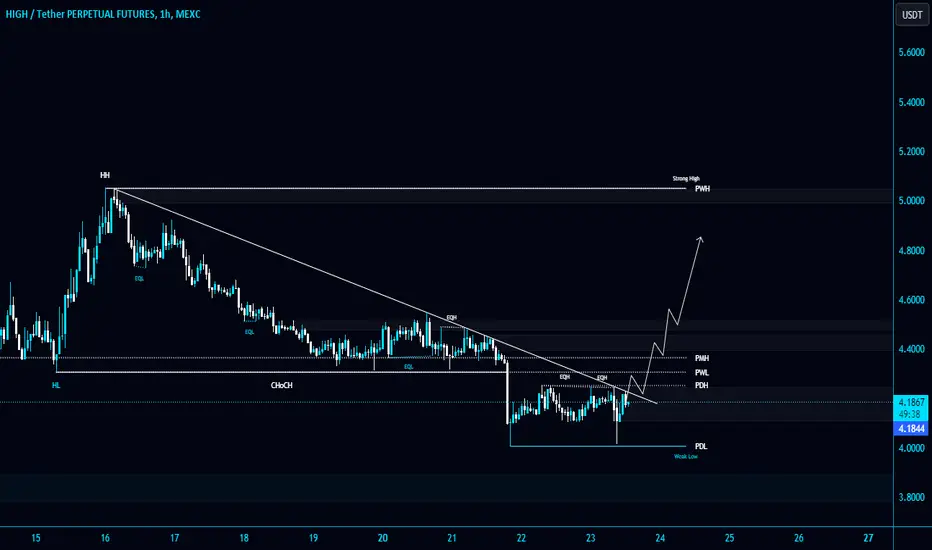
#HIGH/USDT is testing the Diagonal Trendline in 1-Hour TF!#HIGH/USDT is testing the Diagonal Trendline in 1-Hour TF!
AMEX:HIGH needs to break this trendline and PMH $4.365 to turn bullish. Wait for the breakout and retest to long it.
HIGHUSDT trade ideas
HIGHUSDT UPDATE#HIGHUSDT
UPDATE
Moving As Expected & Running In +90%Profit So Far✍
Expecting 150% bullish wave in coming Days..

Get $HIGHHi guys! 👋🏻
🔔 Highstreet has been recovering after a slide to its historic lows. The metaverse has recovered after several notable partnerships and looks to continue its progress in partnering with Web2 corporations.
🔔 RSI, MACD and this rising wedge signal an upcoming slide towards the next support at $3.8 - $3.5. Watch these levels closely.
🔔 The cup is there, waiting for the handle to be formed. When the pattern is completed, the next resistance will be at $7.8.
✊🏻 Good luck with your trades! ✊🏻
If you like the idea hit the 👍🏻 button, follow me for more ideas.

HIGHUSD 1WHIGH ~ 1W
#HIGH This chart is very interesting. provided that #BTC does not go down again.
We placed a small buy on this support block, expecting a retest of this support. but this is a very high risk trade at a time when there is a lot of uncertainty in the market.

HIGHUSDT.1DExamining the 4-hour chart for HIGH/USDT, let's delve into the details:
Key Resistance and Support Levels:
Resistance 1 (R1): The chart does not specify the value, but it seems to lie slightly above the current trading price, potentially near recent highs.
Support 1 (S1): Again, the exact level isn't specified, but it's marked on the upward trend line. A breach below this could signal a reversal of the current trend.
Support 2 (S2): $3.653 - This level might serve as a lower boundary of the trading range if a downtrend confirms.
Support 3 (S3): $2.986 - A significant fall below S2 could see prices testing this next critical support level.
Technical Indicators:
Relative Strength Index (RSI): The RSI at 52.54 is just above the neutral 50, indicating slight bullish momentum but not particularly strong.
Moving Average Convergence Divergence (MACD): The MACD is below the signal line, and the histogram values are negative, suggesting bearish momentum is currently prevailing, though it appears to be weakening as the histogram bars are small.
Trend Analysis:
The price has been following an ascending trend line, supporting the price on pullbacks and indicating an upward trend. This trend line is crucial as a guide for the continuation of the bullish sentiment.
Conclusion:
The current market condition for HIGH/USDT on the 4-hour chart shows a market at a potential turning point. With the RSI near neutral and MACD indicating a bearish momentum, traders should be cautious. The adherence to the ascending trend line will be critical in determining future movements. A hold above this line could see attempts to test R1, while a break below might see the price fall towards S2 and potentially S3 if bearish pressure intensifies.
For trading, consider setting up buy orders near the trend line with stops placed just below to catch potential rebounds while managing risks. Conversely, if the price breaks the trend line decisively, it might be prudent to look for short opportunities towards S2 or S3, keeping an eye on any change in momentum indicated by RSI and MACD for potential exit or entry adjustments.

#HIGH/USDT is testing the Diagonal Trendline in 4-Hour TF!#HIGH/USDT is testing the Diagonal Trendline in 4-Hour TF!
AMEX:HIGH needs to hold this trendline and PMH $4.363 to turn bullish. Wait for the breakdown and retest to shorten it.

High Is Ready To Jump High**Technical Analysis Chart Description:**
Welcome to my Technical Analysis charts on TradingView! Before we dive into the analysis, it's essential to understand some important warnings:
1. **Subjectivity Alert:** Technical analysis involves interpreting market data and chart patterns, which can be subjective. Different analysts may interpret the same data differently, leading to varied conclusions.
2. **Historical Performance Doesn't Guarantee Future Results:** Past price movements do not guarantee future price movements. While historical data can provide insights, it's crucial to consider other factors that could influence price action.
3. **Risk of False Signals:** Technical indicators and chart patterns can produce false signals, leading to potential losses if relied upon blindly. Always cross-verify signals with other indicators or fundamental analysis.
4. **Market Volatility:** Crypto markets are highly volatile and can experience rapid price fluctuations. Be prepared for sudden and unexpected price movements, which may invalidate previously identified patterns.
5. **Risk Management:** Proper risk management is essential. Never invest more than you can afford to lose, and consider using stop-loss orders to mitigate potential losses.
6. **Emotional Bias:** Avoid emotional decision-making based on short-term price movements. Stick to your trading plan and strategy, and don't let fear or greed influence your decisions.
**Disclaimer for Crypto Trading:**
Trading cryptocurrencies carries inherent risks, and it's important to understand the following:
Cryptocurrency markets are highly speculative and can be subject to extreme volatility. Prices can fluctuate significantly within short periods, leading to substantial gains or losses.
Investing in cryptocurrencies involves the risk of total loss of capital. Unlike traditional assets, cryptocurrencies are not backed by any tangible assets or central authority, making them inherently risky.
Regulatory uncertainty and market manipulation are additional risks associated with cryptocurrency trading. Regulatory changes or negative news can have a significant impact on prices.
This analysis is for informational purposes only and should not be construed as financial advice. It's crucial to conduct thorough research and consult with a qualified financial advisor before making any investment decisions in the cryptocurrency markets.
By using this analysis, you acknowledge and accept the risks associated with cryptocurrency trading and agree to trade at your own discretion. The author of this analysis shall not be held responsible for any losses incurred as a result of using the information provided.

a green patternbreak red resistance line up can be very good...
a 100% growth after break ????
wait & watch it
HIGHUSDT IDEAHey traders hope you are enjoying our analysis. Now we are here again with a new trading opportunity. We will discuss today about HIGH
HIGH Running 130% profit so fr
Expecting 150% Bullish wave in few horus📈

💹🎯 "HIGH Coin: Mid-Term Investment Analysis" 📈💡🕵️♂️ Let's delve into this Metaverse coin in the world of cryptocurrency, analyze it, and if we find an entry point, consider adding it to our mid-term portfolio.
🚀 In the weekly timeframe, this project is still relatively new, with limited candle data for diverse analyses. Therefore, we'll keep the analysis simple.
💰 Before diving into the analysis, it's important to note that this coin is a Metaverse crypto, similar to projects like MANA and SandBox, which have recently seen significant growth. It has surged from a price of 1.046 to its current price of 4.311, marking approximately a 300% profit for its holders.
⏳ After about 450 days, we're now revisiting a resistance level we encountered in the past, and we're currently in the process of breaking through this resistance.
🕯️ For an entry point into our mid-term portfolio, we could look at the current weekly candle. If it closes in approximately 1 day and 17 hours in the same bullish manner, it indicates buying pressure, suggesting the potential for growth in this coin.
🛑 For purchasing any coin, we consider a stop-loss strategy :
💼 For this coin, we have three options for setting stop-loss and managing our capital: Firstly, a risky approach would be to set the stop-loss just below the weekly candle, around 3.098, ensuring a quick exit. Secondly, setting the stop-loss around 1.962, allowing for an exit in case of a market trend reversal. And thirdly, allocating a percentage of your total capital to repurchase the coin at the same proportion if the stop-loss is triggered, preventing significant losses if this coin follows Luna's fate.
💹 Confirmation for buying this coin can be found in the volume; during the formation of green candles and an upward trend, we observe an increase in volume. Another confirmation is the entry of RSI into the overbought territory. Unlike most traders, we believe that when RSI penetrates its overbought range, there's a possibility of a pump in this coin.
🛡️ Currently, we only have one resistance ahead after the breakout, which could potentially yield a 70% profit. After reaching this resistance, we'll define our next lines of action in our future analyses.
🌐 Furthermore, I recommend visiting the coin's website and reviewing its whitepaper, as investing in these tokens requires thorough research and time commitment.
😊 If you'd like me to analyze a specific coin or currency pair, be sure to comment so that I can allocate the next analysis for you!
⚠️ Also, please remember that I'm just an analyst, and this isn't financial advice. We're here to stay in the market and maximize profits by adhering to risk and capital management principles.

HIGHUSDT IDEAHey traders hope you are enjoying our analysis. Now we are here again with a new trading opportunity. We will discuss today about HIGH
HIGH So Far So Good Running In +120% Profit So Far✍️

HIGHUSDT UPDATE #HIGHUSDT
UPDATE
Hey all friends and traders. Hope you are enjoying our analysis. we are here to analyze HIGH today.
HIGH is making Bullish Pennant has Already Breakout in 1W time frame.
We can see gain here up to 100%+ profit 🚀


High coin may aim higher.The bollinger band high is also the resistance of the downtrend.
If it can break up both, the rise could be very fast.
* What i share here is not an investment advice. Please do your own research before investing in any digital asset.
* Never take my personal opinions as investment advice, you may lose all your money.

HIGH PriceThe Highstreet token (HIGH) price witnessed a sharp rebound from the 200 day EMA mark and recovered over 95% of gains in the last 10 trading sessions.

HIGHUSDT IDEAHey traders hope you are enjoying our analysis. Now we are here again with a new trading opportunity. We will discuss today about HIGH
HIGH Moving As Expected & Running In +90%Profit So Far✍️
Expecting 150% bullish wave in coming Day's 🚀

HIGHUSDT UPDATE #HIGHUSDT
UPDATE
Hey dear traders hope you are enjoying trading and analysis with our team. we are here to discuss about HIGH
Moving Exactly As We Expected & Running in 20% profit so far⚡️
Expecting more in coming days 🚀
#HIGHUSDT #HIGH #HIGHBTC #BTC #Crypto #HIGH
SET:ORN NYSE:W NASDAQ:FARM LSE:MTL FWB:COS JSE:LSK SEED_DONKEYDAN_MARKET_CAP:BONK AMEX:NEAR NASDAQ:OM $FRONT EURONEXT:CVC
SEED_DONKEYDAN_MARKET_CAP:TFUEL

HIGHUSDT IDEAHello Traders Hope You Are Enjoying Our Analysis. Today We Will Discuss About HIGH
(Update)
Moving Exactly As We Predicted & Running In +20% Profit So Far✅
Still Bullish In Coming Days✍️

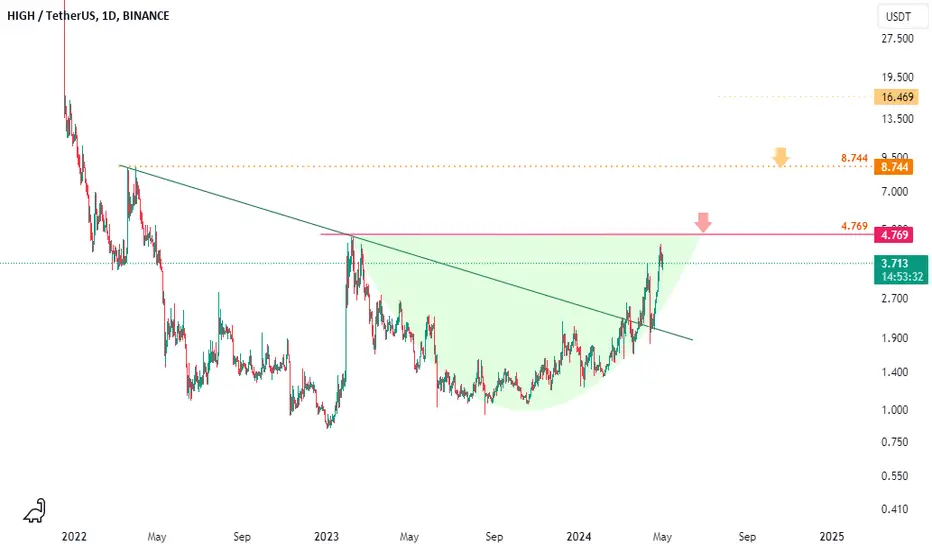
✴️ Highstreet High Targets (345% Profits Potential Or Higher)Highstreet is now on a long-term growth trajectory, the bottom was hit December 2022.
This pair, HIGHUSDT, is now looking really good.
Everything that has been happening for the past 16 months produced a very strong bullish chart.
➖ Last week produced a full green candle with really high volume. This same candle also broke a long-term resistance based on a continuation pattern. These are strong bullish continuation signals.
It is all pretty clear if you ask me: First you see red, then you see green.
You can find the targets clearly depicted on the chart.
👉 The current peak is set at 345% potential or $14.45 —but there can be more, much more... If one can buy and wait (hold/wait patiently until the market rises and is time to sell).
Namaste.

#HIGH/USDT breaks the PWH $3.265 support level#HIGH/USDT breaks the PWH $3.265 support level and heading towards a retest of the Diagonal Trendline in 4-Hour TF!
AMEX:HIGH needs to hold the trendline to gain bullish momentum. Otherwise, it will retest the PMH $2.59 support level.
Wait for a bounce to long or breakdown to short

HIGHUSDT UPDATEAMEX:HIGH
UPDATE
Hey dear members hope you all are enjoying our ideas and analysis. Now we are here to discuss about HIGH
AMEX:HIGH is getting a good volume and leaving the bottom. Here again we can see gain upto 40%+ soon ✍
#HIGH #HIGHBTC #HIGHUSDT #CRYPTO #SIGNALS #BNB #BTC

HIGHUSDT IDEAHello Trading view Family / Fellow Traders.
I hope you have used and benifited from the previous analysis .
In today trading session we are monitoring HIGHUSDT for a buying opportunity,
HIGHUSDT UPDATE
Moving Exactly As we Predicted ,Finally achieved around +80% Profit ✅ 💥

HIGHUSDT IDEAHello Traders Hope You Are Enjoying Our Analysis. Today We Will Discuss About HIGH
(Update)
The Symmetrical Triangle Successfully Breakout In 3D Timeframe✅
Running In +40% Profit So Far & Expecting More In Coming Days✍️
