UJ SELL ZCT FXMarket is showing sign of exhaustion, broke structure..DXY is showing sign of weakness... Market is likely to have a sj=hort term sell
JPYUSD trade ideas

USDJPY Uptrendline Breakout ? 28.05.2024
- Uptrendline breakout to the downside observed on 1hr USDJPY chart
- If breakout holds, potential for rate decrease
- If breakout fails, potential for rate increase
- Risk management recommended
Risk Warning: Trading in CFDs is highly speculative and carries a high level of risk. It is possible to lose all of your invested capital. These products may not be suitable for everyone, and you should ensure that you fully understand the risks taking into consideration your investment objectives, level of experience, personal circumstances as well as personal resources. Speculate only with funds that you can afford to lose. Seek independent advice if necessary. Please refer to our Risk Disclosure.
BDSwiss is a trading name of BDS Markets and BDS Ltd.
BDS Markets is a company incorporated under the laws of the Republic of Mauritius and is authorized and regulated by the Financial Services Commission of Mauritius ( FSC ) under license number C116016172, address: 6th Floor, Tower 1, Nexteracom Building 72201 Ebene.
BDS Ltd is authorized and regulated by the Financial Services Authority Seychelles (FSA) under license number SD047, address: Suite 3, Global Village, Jivan’s Complex, Mont Fleuri, Mahe, Seychelles. Payment transactions are managed by BDS Markets (Registration number: 143350)

USDJPY H4 | Bullish bounce?Based on the H4 chart analysis, we can see that the price is falling to our buy entry at 156.02, which overlaps support close to 38.2% Fibo retracement.
Our take profit will be at 158.00, a swing-high resistance.
The stop loss will be placed at 154.60, which is a pullback support level close to 78.6% Fibo retracement.
High Risk Investment Warning
Trading Forex/CFDs on margin carries a high level of risk and may not be suitable for all investors. Leverage can work against you.
Stratos Markets Limited (www.fxcm.com):
CFDs are complex instruments and come with a high risk of losing money rapidly due to leverage. 68% of retail investor accounts lose money when trading CFDs with this provider. You should consider whether you understand how CFDs work and whether you can afford to take the high risk of losing your money.
Stratos Europe Ltd, previously FXCM EU Ltd (www.fxcm.com):
CFDs are complex instruments and come with a high risk of losing money rapidly due to leverage. 70% of retail investor accounts lose money when trading CFDs with this provider. You should consider whether you understand how CFDs work and whether you can afford to take the high risk of losing your money.
Stratos Trading Pty. Limited (www.fxcm.com):
Trading FX/CFDs carries significant risks. FXCM AU (AFSL 309763), please read the Financial Services Guide, Product Disclosure Statement, Target Market Determination and Terms of Business at www.fxcm.com
Stratos Global LLC (www.fxcm.com):
Losses can exceed deposits.
Please be advised that the information presented on TradingView is provided to FXCM (‘Company’, ‘we’) by a third-party provider (‘TFA Global Pte Ltd’). Please be reminded that you are solely responsible for the trading decisions on your account. There is a very high degree of risk involved in trading. Any information and/or content is intended entirely for research, educational and informational purposes only and does not constitute investment or consultation advice or investment strategy. The information is not tailored to the investment needs of any specific person and therefore does not involve a consideration of any of the investment objectives, financial situation or needs of any viewer that may receive it. Kindly also note that past performance is not a reliable indicator of future results. Actual results may differ materially from those anticipated in forward-looking or past performance statements. We assume no liability as to the accuracy or completeness of any of the information and/or content provided herein and the Company cannot be held responsible for any omission, mistake nor for any loss or damage including without limitation to any loss of profit which may arise from reliance on any information supplied by TFA Global Pte Ltd.
The speaker(s) is neither an employee, agent nor representative of FXCM and is therefore acting independently. The opinions given are their own, constitute general market commentary, and do not constitute the opinion or advice of FXCM or any form of personal or investment advice. FXCM neither endorses nor guarantees offerings of third party speakers, nor is FXCM responsible for the content, veracity or opinions of third-party speakers, presenters or participants.

USDJPY STRUCTURE I know what you are thinking, Dr. Trade are you not seeing a valid supply zone, are you not seeing a valid Order block, are you not seeing a huge level of imbalance, well let me remove you from pattern trading and make you see the bigger picture, this is what we will follow for this pair
#BUYS ONLY

Could USD/JPY bounce from here?Price is falling towards the pivot and could potentially bounce to the 1st resistance which has been identified as a pullback resistance.
Pivot: 156.58
1st Support: 156.01
1st Resistance: 157.97
Risk Warning:
Trading Forex and CFDs carries a high level of risk to your capital and you should only trade with money you can afford to lose. Trading Forex and CFDs may not be suitable for all investors, so please ensure that you fully understand the risks involved and seek independent advice if necessary.
Disclaimer:
The above opinions given constitute general market commentary, and do not constitute the opinion or advice of IC Markets or any form of personal or investment advice.
Any opinions, news, research, analyses, prices, other information, or links to third-party sites contained on this website are provided on an "as-is" basis, are intended only to be informative, is not an advice nor a recommendation, nor research, or a record of our trading prices, or an offer of, or solicitation for a transaction in any financial instrument and thus should not be treated as such. The information provided does not involve any specific investment objectives, financial situation and needs of any specific person who may receive it. Please be aware, that past performance is not a reliable indicator of future performance and/or results. Past Performance or Forward-looking scenarios based upon the reasonable beliefs of the third-party provider are not a guarantee of future performance. Actual results may differ materially from those anticipated in forward-looking or past performance statements. IC Markets makes no representation or warranty and assumes no liability as to the accuracy or completeness of the information provided, nor any loss arising from any investment based on a recommendation, forecast or any information supplied by any third-party.

Long buddy!!!We are primed to rip 80-100 pips high for the rest of the week.
My confluences and entry trigger has been met 3 times for the long push
157.800 is my week target area
Trade safely my friends.

USDJPY: Your Trading Plan For This Week 🇺🇸🇯🇵
USDJPY broke and closed above a key horizontal daily resistance last week.
After a breakout, the market retested a broken structure and started to consolidate.
I see a horizontal trading range on a 4h time frame.
To buy the market with a confirmation,
I am looking for a bullish breakout - a candle close above the resistance of the range.
It will give me a strong intraday signal.
A bullish continuation will be expected at least to 157.5 level then.
❤️Please, support my work with like, thank you!❤️

Targeting Buysidehigher tf bullish. h1 and h4 bisi supporting price. Currently above equilibrium of range

Usdjpy short USD/JPY is the forex ticker that shows the value of the US Dollar against the Japanese Yen. It tells traders how many Yen are needed to buy a US Dollar. The Dollar-Yen is one of the most traded forex pairs - second only to EUR/USD - and is a benchmark for Asian economic health and even the global economy. View the live Dollar-Yen rate with the USD/JPY chart and improve your technical and fundamental analysis with the latest USD/JPY forecast, news and analysis.usdjpy confirm signal

USDJPY May 27, 2024 Has the price started to rise?Looking at the H1 chart we see that the price is in wave 4
- Wave 4 target at price range 156.55
- Then the price continues wave 5 with wave targets at 157.4 and 157.83
We watch to buy at 156.55 after the candlestick reversal signal appears
Note: Sufficient TP, SL to be safe and win the market‼ ️Change data plan will be updated later.
Deekop's analysis is only a personal opinion with a desire to share its views with the community. I'm not always right. But my analysis always reflects my meticulous evaluation of what is best for an investment.

billy forex sa analysis on usdjpyhey guys we back again with signals/analysis todays signal is on usdjpy currently on into profiits strategy sseems accurate/approved singal :sell usdjpy at current zone tp:open

USDJPY 27.05.2024Macroeconomic News:
The Japanese Yen (JPY) appreciated on Monday, ending a three-day losing streak, following comments from Bank of Japan (BoJ) Governor Kazuo Ueda. Ueda emphasized the need to re-anchor inflation expectations toward the 2% target. Japan's annual inflation remains above the BoJ's 2% target, increasing pressure on the central bank to tighten monetary policy. Simultaneously, the US Dollar Index (DXY) weakened due to lower yields on the 10-year US Treasury bonds, influenced by the University of Michigan's slightly lower 5-year inflation expectations.
Technical Analysis:
The USD/JPY pair traded near 156.70 on Monday, indicating a potential bearish reversal through an ascending wedge pattern on the daily chart. The 14-day Relative Strength Index (RSI) remains slightly bullish, above the 50 level. The first resistance level is at the upper boundary of the ascending wedge around 157.30; surpassing this level, the pair could aim for the highest level in over thirty years at 160.32. Immediate support is at the 9-day Exponential Moving Average (EMA) at 156.40, followed by the lower boundary of the ascending wedge and the psychological level at 156.00. If these levels are breached, the pair may decline to support at 151.86.

USD/JPY Analysis: The Market is Indecisive Near Its PeakUSD/JPY Analysis: The Market is Indecisive Near Its Peak Since May 1
As the USD/JPY chart shows today:
→ The price is in an upward trend (indicated by the blue channel) that has been relevant since the beginning of 2024.
→ On Thursday, May 23, the exchange rate nearly reached 157.2 yen per US dollar, surpassing the peak of May 14.
→ Following this, the market began to stabilise – indicated by the Bollinger Bands' width showing low volatility, which can be interpreted as a sign of market equilibrium or indecision among participants.
What balances the market? The equilibrium of supply and demand forces and the anticipation of important news in the week ahead.
Bullish arguments:
→ The price has twice (shown by arrows) rebounded sharply from the median line of the upward channel. On both occasions, bulls managed to reverse aggressive declines in the USD/JPY price and return to the upper line.
→ The Bank of Japan's interest rates are much lower than those in the US. Judging by the latest US economic data, the Federal Reserve may maintain high rates for a longer period.
Bearish arguments:
→ We do not see continued upward momentum in the price after surpassing the May 14 peak. Moreover, the USD/JPY price cannot sustain above the "round" level of 157.00.
→ The price is near the upper boundary of the channel, which could act as resistance.
→ It is important to note the levels of 160 and 157.9 in the background, from which the price fell sharply, indicating possible intervention by the Bank of Japan to support the excessively weak yen.
Given that today is a holiday for financial institutions in the US and the UK, indecision may continue until tomorrow when Japan's inflation data is released at 8:00 GMT+3. Also noteworthy:
→ US GDP news will be published on Thursday at 15:30 GMT+3.
→ The US Personal Consumption Expenditures (PCE) index will be released on Friday at 15:30 GMT+3.
These and other fundamental drivers may disrupt the current balance of the USD/JPY price, which still appears stable for now.
Trade over 50 forex markets 24 hours a day with FXOpen. Take advantage of low commissions, deep liquidity, and spreads from 0.0 pips. Open your FXOpen account now or learn more about trading forex with FXOpen.
This article represents the opinion of the Companies operating under the FXOpen brand only. It is not to be construed as an offer, solicitation, or recommendation with respect to products and services provided by the Companies operating under the FXOpen brand, nor is it to be considered financial advice.

USDJPYDear traders! USD/JPY remained on the weak side during the Asian session on Monday, weakened by recent cautious comments from BoJ policymakers and a broadly depreciated US dollar. The pair did not benefit from the modestly upbeat market mood as thin trading limited movement.
In terms of medium and long term, I am personally still optimistic about the prospect of price increases when UJ has escaped the symmetrical triangle. According to statistics the strongest volatility is after a breakout, it is expected that if the upward momentum continues from the upper boundary of the rising wedge around 154.20 then the local high of 158.50 will be tested again with the aim of breaking rupture and strengthen further.

XAUUSD LookoutNo good trader likes trading on a Monday But it is a business day after all. Gold has been going down recently. We are just planning on capitalizing on the downward trend. So we see a little bit of flag formation and we are going for it.

USDJPY continued its upward trajectory on MondayUSDJPY continued its upward trajectory on Monday, consolidating above the 156.00 handle. Should this momentum pick up later in the week, resistance appears at 158.00, followed by 160.00. It's important to exercise caution with any ascent towards these levels, considering the possibility of FX intervention by Japanese authorities to bolster the yen. Such a move could quickly send the pair into a tailspin.
Alternatively, if selling pressure resurfaces and prompts the pair to reverse course, initial support is positioned at 154.65. While prices are expected to stabilize around this zone during a pullback, a breakdown could precipitate a swift decline toward 153.15. If weakness persists, attention could turn to trendline support and the 50-day simple moving average near 152.50.

USDJPY is once again approaching the 160 levelJapanese officials recently intervened in the foreign exchange market as the USD/JPY exchange rate approached the 160 level. However, this time the upward movement has been more gradual and less volatile, prompting no action from Japanese officials.
The USD/JPY pair is currently trading above 157.00 and has rebounded strongly off the 50-day SMA in early May. The issue of yen weakness is likely to persist due to the significant interest rate differential between the United States and Japan, supporting the carry trade.

USD/JPY For Long as Swing Tradewe have two scenarios
first : go long now with confirmation with break current resistance at green arrow
second : wait for pull-back and create higher low at Blue Arrow or area between (50:61) fibo levels
personally i prefer for open long trade with low trade size and open again when break resistance at green arrow , if price pull back i will open double size trade to gain the profit ,i think target 3 will be swing trade so be patient
have fun :)

What Is Behavioural Finance?What Is Behavioural Finance?
Behavioural finance is a field that combines the principles of psychology and economics to understand how human behaviour affects financial decisions and markets. It recognises that people are not always rational, and their emotions, biases, and cognitive errors can influence their financial choices.
Behavioural finance is a growing field of study that continues to gain recognition and influence in the sector. Researchers study how people process information, how they form expectations, and how they react to market events. In this FXOpen article, we will consider the cornerstones of behavioural finance theory.
Behavioural Finance Definition
Let’s start with the behavioural finance theory. Behavioural finance is the study of how psychological factors, such as emotions and biases, impact financial decision-making and market outcomes. It seeks to explain why people often deviate from rationality when making financial decisions and how these deviations lead to market fluctuations.
The emergence of behavioural finance can be traced back to the groundbreaking work of Daniel Kahneman and Amos Tversky in the 1970s. Today, big-name universities around the world continue to study the impact of different factors on decision-making in business, investing, and personal finance.
Understanding Economic Behaviour and Psychology
Behavioural finance recognises that economic behaviour is determined by more than rationality and self-interest. The study takes into account the following psychological factors:
Emotional influence. Emotions like fear, greed, and overconfidence lead a person to make irrational choices, e.g. adding funds to a losing trade or changing take-profit targets to cover more gains.
Behavioural financial biases. Many biases influence decision-making, for example, confirmation bias (favouring information that confirms pre-existing beliefs) and accessibility bias (overestimating the importance of readily available information).
Cognitive errors. People are prone to cognitive errors, such as overestimating their abilities or relying on heuristics (mental shortcuts) instead of careful analysis.
What Is Economic and Financial Heuristics?
Heuristics is the process by which people use mental shortcuts and simple strategies to quickly form judgements and make decisions. In the context of behavioural finance, economic and financial heuristics refer to cognitive shortcuts that simplify financial decision-making. The most common of them include:
Representativeness heuristic: judgments are based on similarity to a prototype or stereotype. For example, an investor may assume that a company with a well-known brand is a safer investment, even if there is no objective evidence to support this belief.
Availability heuristic: judgments rely on the ease with which relevant examples or information come to mind. For example, an investor may invest in a particular industry if they recently read positive news about it, even if the overall market conditions are unfavourable.
Anchoring heuristic: this involves individuals forming estimates by commencing from an initial value, often referred to as an "anchor." For example, an investor may anchor their price estimate for a stock based on its current market price, even if the fundamental factors suggest a different valuation.
If you are interested in the topic of trading psychology and want to learn more, explore our blog. We’ve posted several related articles you may like. We are happy to provide our clients with valuable insights that could help them gain new skills and knowledge.
Behavioural Finance Biases
As we mentioned, behavioural finance recognises that investors can be irrational and that their decisions can be influenced by biases. Here are some of the potential biases:
Self-attribution bias — traders attribute positive investment results to their own skills and blame negative results on external factors or bad luck.
Confirmation bias — people pay close attention to information that supports a financial or investment belief and disregard whatever contradicts it.
Framing bias — an investor reacts to a certain financial opportunity based on how it is presented. The way information is framed influences their choices.
Loss aversion — the fear of losing money may become a more powerful inhibitor for an investor; if it is, they won’t take risks and may miss out on potential profits.
Cognitive Errors
Apart from behavioural biases in finance, there are inefficient decisions that could be partially the result of cognitive errors. Cognitive distortions are rigid errors in thinking that grossly misinterpret events in harmful or negative ways. These patterns are full of assumptions and incorrect logic, while real-world evidence does not back them up. The most common errors include:
Filtering
Polarisation
Overgeneralisation
Discounting the positive
Hasty conclusions
Catastrophising
Everyone falls into cognitive distortions from time to time, but if you engage too frequently in negative thoughts, your mental health can take a hit.
Emotional Reasoning
Emotional reasoning refers to a cognitive mechanism through which a person arrives at the belief that their emotional reaction validates the truth of a statement or situation, even in the presence of contradictory evidence. Fear and greed are strong emotions that often drive people to make blind decisions. Fear can lead to panic selling during market downturns, while greed can lead to excessive risk-taking and speculative behaviour.
How Does Investor Behaviour Differ?
The frequent prejudices seen in investor behaviour are:
Herding — when investors follow the crowd and base their actions on what others do (buy, hold, or sell).
Overconfidence — when investors overestimate their abilities and believe they can consistently outperform the market.
How Does Trader Behaviour Differ?
Traders may be influenced by the following:
Momentum trading — when they follow trends and buy or sell based on recent price movements rather than fundamental analysis.
Overtrading — when traders engage in excessive buying and selling, driven by emotions like fear or greed.
Confirmation bias — when traders overvalue their pre-existing beliefs and ignore contradictory evidence.
Market Psychology
Market psychology is based on the emotional factors that influence the decisions of participants in financial markets. People's behaviour is often driven by their perceptions, beliefs, and expectations about the market and the economy. They are influenced by news events, economic data, and geopolitical developments. Let’s consider three common examples of market inefficiencies explained by psychology:
Market bubbles , when asset prices become detached from their underlying fundamentals, can be driven by herd behaviour and excessive optimism.
Market crashes , when assets lose value for no particular reason, can be triggered by panic selling and fear.
Market anomalies , such as the value premium or the momentum effect, suggest that investors deviate from rationality and create opportunities for profit. These anomalies cannot be explained by traditional studies but can be justified by behavioural finance theories.
Final Thoughts
In recent years, this field has gained momentum; for example, scientists exploring the impact of the COVID-19 pandemic and the development of online services that influence consumer preferences. As this field evolves, it’s likely to have a significant impact on the way we think about investing and managing risk.
Technical analysis indicators may help traders overcome behavioural finance bias and base their decisions on price data and effective indicators and patterns that have been used by traders for years. To try them, you can use the FXOpen TickTrader platform. If you are ready to start trading, you can open an FXOpen account.
This article represents the opinion of the Companies operating under the FXOpen brand only. It is not to be construed as an offer, solicitation, or recommendation with respect to products and services provided by the Companies operating under the FXOpen brand, nor is it to be considered financial advice.

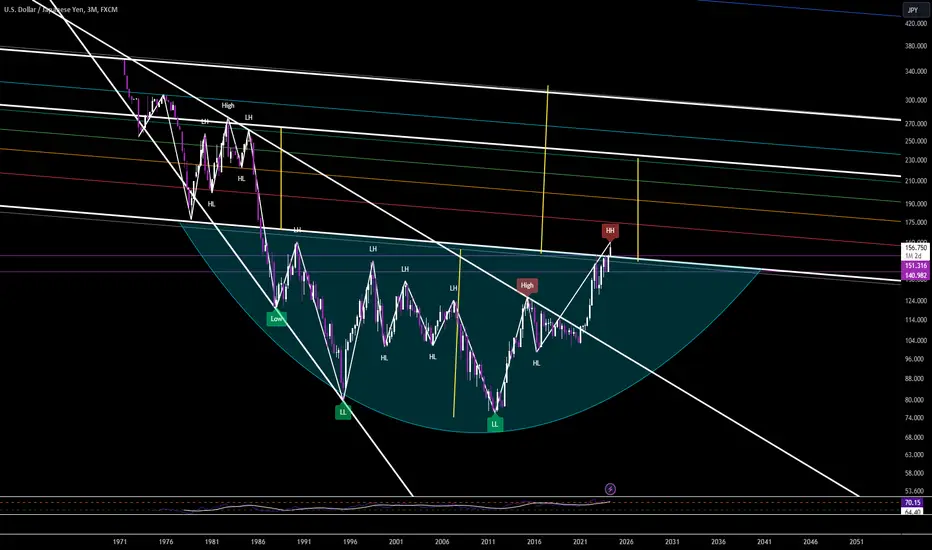
usdjpy 3m usdjpy looking like a major 3m key support has been broken with possible measured move targets set.
USDJPY Long Fundamental Analysis ### USD/JPY Detailed Analyst Report and Projections
#### Current USD/JPY Price
As of today, May 27, 2024, the USD/JPY exchange rate opened at approximately 157.00. This will serve as the reference point for our short-term (1-3 months) and long-term (6-12 months) projections.
### Recent Key Data Releases and Their Impact
#### United States
1. **Non-Farm Payrolls (NFP) - May 3, 2024**
- **Actual**: 250,000
- **Expected**: 200,000
- **Impact**: Better than expected. Positive impact on USD as it indicates a strong job market, suggesting economic resilience.
2. **Consumer Price Index (CPI) - May 10, 2024**
- **Actual**: 4.2%
- **Expected**: 4.0%
- **Impact**: Higher than expected. Positive for USD as it may lead to hawkish Fed policies to control inflation.
3. **Federal Reserve Interest Rate Decision - May 15, 2024**
- **Actual**: 0.25% hike to 5.25%
- **Expected**: 0.25% hike
- **Impact**: In line with expectations. Reinforces the strength of USD due to ongoing tight monetary policy.
4. **Retail Sales - May 17, 2024**
- **Actual**: 0.6%
- **Expected**: 0.4%
- **Impact**: Better than expected. Positive for USD indicating strong consumer spending.
5. **Gross Domestic Product (GDP) - Q1 2024 - April 28, 2024**
- **Actual**: 2.1%
- **Expected**: 2.0%
- **Impact**: Slightly better than expected. Positive for USD indicating solid economic growth.
#### Japan
1. **Gross Domestic Product (GDP) - Q1 2024 - April 25, 2024**
- **Actual**: 1.2%
- **Expected**: 1.5%
- **Impact**: Worse than expected. Negative impact on JPY as it indicates weaker economic growth.
2. **Consumer Price Index (CPI) - May 12, 2024**
- **Actual**: 0.9%
- **Expected**: 1.1%
- **Impact**: Lower than expected. Negative for JPY indicating weaker inflation pressures.
3. **Bank of Japan (BoJ) Interest Rate Decision - April 27, 2024**
- **Actual**: Maintained at -0.10%
- **Expected**: Maintained
- **Impact**: In line with expectations. Neutral impact.
4. **Industrial Production - May 8, 2024**
- **Actual**: -0.5%
- **Expected**: 0.2%
- **Impact**: Worse than expected. Negative for JPY indicating economic weakness.
5. **Unemployment Rate - April 28, 2024**
- **Actual**: 2.7%
- **Expected**: 2.6%
- **Impact**: Slightly worse than expected. Negative for JPY as it suggests a slight weakening in the labor market.
### Upcoming Data and Projections
#### United States
1. **Federal Reserve Meeting Minutes - June 20, 2024**
- **Projection**: Likely to reinforce a hawkish stance given recent strong data. Expected to be positive for USD.
2. **Non-Farm Payrolls (NFP) - June 2, 2024**
- **Projection**: Likely to come in strong based on recent trends. Positive for USD.
3. **Consumer Price Index (CPI) - June 12, 2024**
- **Projection**: Expected to be around 4.1%, slightly lower than previous but still indicating inflation pressures. Slightly positive for USD.
#### Japan
1. **Bank of Japan (BoJ) Policy Meeting - June 16, 2024**
- **Projection**: No change in policy expected, but any hints of future easing could weaken JPY further. Neutral to negative for JPY.
2. **Gross Domestic Product (GDP) - Q2 2024 - July 25, 2024**
- **Projection**: Likely to show continued weakness based on current trends. Negative for JPY.
3. **Consumer Price Index (CPI) - June 12, 2024**
- **Projection**: Expected to be around 1.0%, slightly higher but still weak. Neutral to slightly positive for JPY.
### Tally of Good and Bad
#### For USD
- **Good**: Strong NFP, CPI, Retail Sales, GDP, and ongoing hawkish Fed stance.
- **Bad**: None significant recently.
#### For JPY
- **Good**: None significant recently.
- **Bad**: Weaker GDP, CPI, Industrial Production, and slightly higher unemployment.
### Short-Term Projection (1-3 months)
Based on the recent strong US data and the weaker Japanese data, the USD is likely to continue strengthening against the JPY in the short term. The ongoing hawkish stance by the Fed and the anticipated continuation of weak economic data from Japan support this view.
**Projection**: USD/JPY is expected to rise to approximately 160.00 - 162.00 within the next 1-3 months.
### Long-Term Projection (6-12 months)
In the longer term, the USD is likely to maintain its strength against the JPY, but the rate of appreciation may moderate as some of the positive effects are priced in. Additionally, any potential improvement in the Japanese economy or a shift in BoJ policy could influence the exchange rate.
**Projection**: USD/JPY is expected to be in the range of 165.00 - 167.00 within the next 6-12 months.
### Conclusion
The fundamental analysis indicates a strong USD driven by positive economic data and a hawkish Fed, against a weaker JPY impacted by underwhelming economic performance. Both short-term and long-term projections suggest an appreciating USD/JPY, with rates expected to rise moderately over the next year.
These projections are based on the current fundamental data and the assumption that upcoming data will continue to follow the recent trends. Any significant deviations in future data releases could alter these projections.

USDJPY Long on breakout and long-term outlook1. USDJPY going for 5th wave up in the short term.
2. Long term is extremely concerning as there are no resistance above 161. Might move above 200.

USDJPY - expect volatility to qNPOC 159 levelUSDJPY remains one of the most volatile pairs. With the BOJ manipulating the books to destroy both long and short biased traders, I expect the quarterly NPOC to be hit at approximately 159 level.
This will also cause a 'fake out' from the ascending channel, likely triggering short traders to be stopped out, and then from those levels, we may see BOJ to start buying the yen again.
The CTFC COT report suggests that most retail traders are shorting the USDJPY, whereas hedge funds and asset funds are long the USDJPY. This leads me to believe that we will see higher prices at least in the short-medium term.
