USDJPY - analysis and trade I always suggest the big positions because most of the time you get the most profit
JPYUSD trade ideas


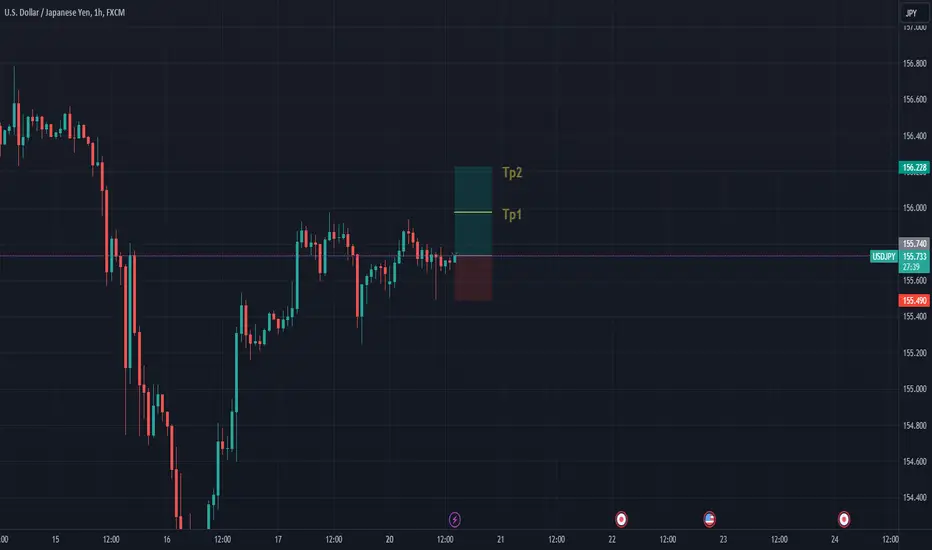
USDJPY Bullish - May 20📢 Signal: BUY USDJPY 📈
Entry Point: 155.728 🔍
TP1: 155.978 🎯 (25 pip TP)
TP2: 156.228 🎯 (50 pip TP)
SL: 155.478 ⛔️ (25 pip SL)
Ensure proper risk management when following signals! 💡
@Mr_Bombastic_Signal
Bearish Setup With USDJPY - SMC ConceptHi Everyone , Hope you're fine
Today's Analysis is with USDJPY
The price when went into DAILY FVG and respected it , the price couldn't move above it or close inside it ,
Ofc , with that perspective we can see that in LTF the price is making MSS
Also keep in mind that DXY is respecting the daily FVG , that supports our analysis to stay bearish in this pair
This is an educational analysis
if you want to take it , make sure to implement a risk management according to your account's balance
THE RR is almost 6RR
Good Luck Everyone

USDJPY TRADE IDEAAt these type of ideas i will try to show you were the charts have big possibilities to bounce back , depends on ICT point of view.
Have in mind that those special zones are NOT trade signals , but areas where you have to applicate your specific strategy.

USDJPY : Continue the new way to detect the peak!The USD/JPY pair has been trading in positive territory for the third consecutive day, hovering around 155.80 during the early Asian session on Monday. The decline in this currency pair has been supported by weaker-than-expected GDP data from Japan for the first quarter. However, it has not yet broken out of the consolidation pattern evident on the analysis charts.
It is expected to continue moving sideways as it seeks additional momentum before potentially resuming a stronger upward trend.

USDJPY Berish Sell Now#USD/JPY bearish now
Sell sentiment on ,usd going weaker so guys this the time to sell and book huge profits
Follow my chart analysis

USDJPY Bearish ContinuationThe USD/JPY is one of the sell pairs we have from the portfolio selection we did yesterday.
The Major pull for us thinking of shorting this pair is the wave structure (3) Momentum Low; this price point has over 70% probability that at some time in the future, the price will come back there after a retracement.
On Friday,15-minute timeframe, we saw a breakdown which signifies a continuation of the downtrend.
Here are the key prices we should be looking at:
Sell Below: 155.60
Sell Confirmation: 155.24
Stop Loss: 156.02
Sell target T1 152.85

Could USD/JPY reverse from here?Price is rising towards a resistance level which is a pullback resistance that aligns with the 61.8% Fibonacci projection and could potentially reverse from this level to our take profit.
Entry: 156.58
Why we like it:
There is a pullback resistance level which lines up with the 61.8% Fibonacci projection.
Stop loss: 158.25
Why we like it:
There is a pullback resistance level which is slightly below the 161.8% Fibonacci extension.
Take profit: 153.64
Why we like it:
There is a pullback support level.
Please be advised that the information presented on TradingView is provided to Vantage (‘Vantage Global Limited’, ‘we’) by a third-party provider (‘Everest Fortune Group’). Please be reminded that you are solely responsible for the trading decisions on your account. There is a very high degree of risk involved in trading. Any information and/or content is intended entirely for research, educational and informational purposes only and does not constitute investment or consultation advice or investment strategy. The information is not tailored to the investment needs of any specific person and therefore does not involve a consideration of any of the investment objectives, financial situation or needs of any viewer that may receive it. Kindly also note that past performance is not a reliable indicator of future results. Actual results may differ materially from those anticipated in forward-looking or past performance statements. We assume no liability as to the accuracy or completeness of any of the information and/or content provided herein and the Company cannot be held responsible for any omission, mistake nor for any loss or damage including without limitation to any loss of profit which may arise from reliance on any information supplied by Everest Fortune Group.

USDJPY TRADE SETUPMarket trend is down so I think this week falling the price so let's see the market what happened guys

USD JPYexpecting shorts by respecting this level @ ~ 155.9
closing above this level will take us higher to 160.175 .

USDJPYWe give attention to the highlighted area any price action we sell or buy. And moves the stop loss to the entry after 50 pips and close half trade

USD JPY X SETUP x stup coming hurry up stay tuned when which side breking up it will come back red zone PLESE WAIT UNTIL BREAKOUT ZONE WHEN PULLBACK TO RED ZONE USE 30-60 PIP BE

USD JPY X SETUP x stup coming hurry up stay tuned when which side breking up it will come back red zone PLESE WAIT UNTIL BREAKOUT ZONE WHEN PULLBACK TO RED ZONE USE 30-60 PIP BE

USDJPYUSDJPY has been on an uptrend the last 2 weeks but am seeing two possible case scenarios, if price touches 157.937 area we look for sells if price respects it.But if we go down ill look for buys at 154.101

NEW IDEA FOR USDJPY The absence of currency intervention will change the divergence of monetary policy towards the US dollar
By examining the trend in the four-hour time frame, USD/YEN, while maintaining the important support interval in the range of 154.33-153.74, can increase to the resistance range of the ceiling of the ascending channel in the range of 161.30-160.21.

USDJPY Forecast for the WeekThe USD/JPY pair is experiencing volatility this week, driven by economic indicators and central bank sentiments. Initially pressured by lower-than-expected April inflation data, the US dollar saw potential for Fed policy easing, though Fed representatives have remained cautious. Weak preliminary Japanese GDP figures further contributed to uncertainty, potentially delaying Bank of Japan interest rate hikes. Technically, the pair is within a long-term ascending channel, with resistance at 156.25 and support at 153.12. Technical indicators suggest an uptrend continuation, but traders are closely monitoring central bank actions and key levels for further direction.
Resistance levels: 156.25, 159.37, 162.50.
Support levels: 153.12, 150.00.
Long positions can be opened above the 156.25 mark with targets of 159.37, 162.50 and stop-loss around 154.00.
Short positions should be opened below the level of 153.12 with the target of 150.00 and stop-loss around 155.20.

A forecast update on the upcoming movement of the dollar and yenA forecast update on the upcoming movement of the dollar and yen in the long term

USDJPYFriday i took this trade. i already mentioned it in chart.
Reason to took:
1. Breakout the support area and retest.
simple trade and Profit took.

UJ shortusdjpy has been having a great and unpredictable path past few days with major news events and BOJ interventions and it was great for those who caught the moves but now its getting stable. On my current chart im waiting on the short which i have a tight stoploss to becouse this is not my initial trade the market is currently about to break out so once it does that will show the swing trade to drive the market. The current sentiment bullish but change is possible

🔴📈 Strong Selldue to entering the range from which we had the fall before. You can apply for sales positions. Areas and limit of profit and limit of loss are specified in the chart.

USDJPY 1H Short Trade - 1:6 RRRSL: 156.610
TP: 153.449
In this trading strategy, we present a compelling opportunity for a long position on the USDJPY currency pair, focusing on the 1-hour timeframe. By incorporating key technical indicators such as the Exponential Moving Average (EMA) 200, Moving Average Convergence Divergence (MACD) for trend analysis, and Supertrend for entry signals, traders can aim to achieve a favorable risk-to-reward ratio of 1:6.
Indicators:
EMA200: The EMA200 serves as a critical indicator of the long-term trend direction.
MACD Trend: The MACD indicator helps traders assess the strength and direction of the trend.
Supertrend: The Supertrend indicator acts as a reliable tool for identifying entry points in alignment with the prevailing trend.

USD/JPYA double top is a bearish reversal chart pattern that typically signals the end of an uptrend and the beginning of a downtrend. It is one of the most common and reliable patterns in technical analysis, indicating that the asset may have reached a significant resistance level.
### Characteristics of a Double Top
1. **Shape**: The double top pattern resembles the letter "M" with two distinct peaks (tops) at approximately the same price level, separated by a moderate trough (valley).
2. **Peaks and Troughs**:
- **First Peak**: The price reaches a high point and then declines.
- **Trough**: After the first peak, the price falls to form a low point.
- **Second Peak**: The price rises again to a level close to the first peak but fails to break through the resistance, then declines once more.
3. **Neckline**: The trough (valley) between the two peaks forms a support level known as the neckline. This is a key level that traders watch for a breakout.
### Trading the Double Top
To effectively trade a double top pattern, traders generally follow these steps:
1. **Identify the Pattern**: Recognize the formation of two peaks at nearly the same level, with a trough in between.
2. **Confirmation**: Wait for the price to break below the neckline (the support level at the trough). This breakout confirms the pattern and suggests a bearish reversal.
3. **Entry Point**: Enter a short position (or sell) at the point where the price breaks below the neckline.
4. **Stop-Loss Placement**: Place a stop-loss order above the second peak to manage risk. This helps protect against false breakouts.
5. **Target Price**: Measure the distance from the peak to the neckline. Subtract this distance from the breakout point to set a potential target price. This gives an estimate of the expected price movement following the pattern's completion.
### Example
Here’s an illustrative example of a double top pattern:
1. **Formation**:
- The price of a stock rises to $50 (first peak) and then declines to $45 (trough).
- It rises again to $50 (second peak) but fails to break above this level.
- The price then falls back to $45 (neckline).
2. **Confirmation and Breakout**:
- The price breaks below $45, confirming the double top pattern.
3. **Trade Execution**:
- Enter a short position at the breakout point ($45).
- Place a stop-loss order above the second peak (e.g., $51) to manage risk.
- Set a target price by measuring the distance from the peak to the neckline ($50 - $45 = $5). Subtract this distance from the breakout point ($45 - $5 = $40) for a target price of $40.
### Psychological Aspect
The double top pattern reflects a battle between buyers and sellers. The first peak indicates resistance where sellers overpower buyers, leading to a decline. The second peak confirms that buyers are unable to push the price higher, reinforcing the resistance level. The failure to break above this resistance level and the subsequent break below the neckline signal a shift in sentiment from bullish to bearish.
Understanding and identifying the double top pattern can help traders anticipate potential reversals and make more informed trading decisions.
