USDJPY
Looking Bullish on all Indicators all Green
But Dangerous area for sure
Had no intervention for a while ya never know
Buy above Buffer Zone after Pull Back for greater possibility
Less resistance look left from there
JPYUSD trade ideas


USDJPY The Target Is DOWN! SELL!
My dear subscribers,
USDPJPY looks like it will make a good move, and here are the details:
The market is trading on 155.69 pivot level.
Bias - Bearish
Technical Indicators: Both Super Trend & Pivot HL indicate a highly probable Bearish continuation.
Target - 155.55
About Used Indicators:
The average true range ATR plays an important role in 'Supertrend' as the indicator uses ATR to calculate its value. The ATR indicator signals the degree of price volatility.
———————————
WISH YOU ALL LUCK

Its about timeAll ideas are strictly my interpretation of price action. I am not a professional trader nor is this
professional advice.
I will continually update all trades.


USDJPY - SELL (DONT MISS THIS TRADE)USDJPY - SELL (DONT MISS THIS TRADE)
157.00 is a good level to loo for sell, or it can go above by wick and drop harder 600pip+
if you u got the sell setups on this levels dont miss them, also risk small and use SL
V.Ragu

USDJPY H4 | Bearish Drop Based on the H4 chart analysis, we can see that the price is currently at our sell entry at 155.80, which is an overlap resistance
Our take profit will be at 153.36, an overlap support
The stop loss will be placed at 157.93, which is a swing high resistance
High Risk Investment Warning
Trading Forex/CFDs on margin carries a high level of risk and may not be suitable for all investors. Leverage can work against you.
Stratos Markets Limited (www.fxcm.com):
CFDs are complex instruments and come with a high risk of losing money rapidly due to leverage. 68% of retail investor accounts lose money when trading CFDs with this provider. You should consider whether you understand how CFDs work and whether you can afford to take the high risk of losing your money.
Stratos Europe Ltd, previously FXCM EU Ltd (www.fxcm.com):
CFDs are complex instruments and come with a high risk of losing money rapidly due to leverage. 70% of retail investor accounts lose money when trading CFDs with this provider. You should consider whether you understand how CFDs work and whether you can afford to take the high risk of losing your money.
Stratos Trading Pty. Limited (www.fxcm.com):
Trading FX/CFDs carries significant risks. FXCM AU (AFSL 309763), please read the Financial Services Guide, Product Disclosure Statement, Target Market Determination and Terms of Business at www.fxcm.com
Stratos Global LLC (www.fxcm.com):
Losses can exceed deposits.
Please be advised that the information presented on TradingView is provided to FXCM (‘Company’, ‘we’) by a third-party provider (‘TFA Global Pte Ltd’). Please be reminded that you are solely responsible for the trading decisions on your account. There is a very high degree of risk involved in trading. Any information and/or content is intended entirely for research, educational and informational purposes only and does not constitute investment or consultation advice or investment strategy. The information is not tailored to the investment needs of any specific person and therefore does not involve a consideration of any of the investment objectives, financial situation or needs of any viewer that may receive it. Kindly also note that past performance is not a reliable indicator of future results. Actual results may differ materially from those anticipated in forward-looking or past performance statements. We assume no liability as to the accuracy or completeness of any of the information and/or content provided herein and the Company cannot be held responsible for any omission, mistake nor for any loss or damage including without limitation to any loss of profit which may arise from reliance on any information supplied by TFA Global Pte Ltd.
The speaker(s) is neither an employee, agent nor representative of FXCM and is therefore acting independently. The opinions given are their own, constitute general market commentary, and do not constitute the opinion or advice of FXCM or any form of personal or investment advice. FXCM neither endorses nor guarantees offerings of third party speakers, nor is FXCM responsible for the content, veracity or opinions of third-party speakers, presenters or participants.

USDJPY at an important barrier#USDJPY EASYMARKETS:USDJPY
Disclaimer:
easyMarkets Account on TradingView allows you to combine easyMarkets industry leading conditions, regulated trading and tight fixed spreads with TradingView's powerful social network for traders, advanced charting and analytics. Access no slippage on limit orders, tight fixed spreads, negative balance protection, no hidden fees or commission, and seamless integration.
Any opinions, news, research, analyses, prices, other information, or links to third-party sites contained on this website are provided on an "as-is" basis, are intended only to be informative, is not an advice nor a recommendation, nor research, or a record of our trading prices, or an offer of, or solicitation for a transaction in any financial instrument and thus should not be treated as such. The information provided does not involve any specific investment objectives, financial situation and needs of any specific person who may receive it. Please be aware, that past performance is not a reliable indicator of future performance and/or results. Past Performance or Forward-looking scenarios based upon the reasonable beliefs of the third-party provider are not a guarantee of future performance. Actual results may differ materially from those anticipated in forward-looking or past performance statements. easyMarkets makes no representation or warranty and assumes no liability as to the accuracy or completeness of the information provided, nor any loss arising from any investment based on a recommendation, forecast or any information supplied by any third-party.

USDJPYThis Weekly FORECAST
Opportunity for USDJPY. This setup trading idea is for swing. >> TAYOR
Risk Factors:
1. Market conditions, unexpected news, or external events could impact the trade.
2. Always use risk management strategies to protect your capital.

USDJPYLooking for a sell opportunity.
Reason to sell:
1) Breakout uptrend line
2) forming 'M' Pattern in 5 minute chart
- Use proper risk management.
Thank you

USDJPY | $50 Billion Interventions Wasted? | 13-17/5/2024The published minutes of the BoJ meeting show that most board members took a “hawkish” stance, calling for a rate hike. However, many analysts believe that the Bank of Japan will take only one such step in the second half of the year.
Technical Analysis
USD/JPY rally is set to continue, as momentum is on the side of buyers, as depicted by the Relative Strength Index (RSI). That, along with prices standing above the Ichimoku Cloud, could pave the way for bulls to challenge 156.2 in the near term. On the other hand, a drop below 155.78 could pave the way to challenge 155.22, followed 154.92.

1:10 ratio Sell usdjpy 15m 13-5-2024This is wycoff wave
Great ratio hope this goes well
Use risk managment
Good luck

USDJPY Buy IdeaInvestors will be looking at the U.S. producer price index and consumer price index data this week for any indication that price pressures are finally easing after months of strong inflation gave rise to fears that the Federal Reserve may not cut interest rates this year.
Markets got some relief earlier this month when Fed Chair Jerome Powell indicated that the central bank was still looking to eventually cut rates and the latest U.S. employment report showed signs of cooling in the labor market.
Analysts expect Wednesday's crucial CPI report to show underlying inflation rising 3.6% on a year-over-year basis, which would be the smallest increase in over three years.
But a hotter-than-expected inflation reading would likely price out rate cuts for the rest of the year, reigniting market volatility.

Short.dailySell position against the trend, so be careful.
This is my opinion and it may be 100% wrong

Strategic #USDJPY H1 Trading: Maximizing Opportunities with Pati#USDJPY H1 Strategy: Last week's #USDJPY trade yielded significant gains, even though our final target of 157.20 was not reached. The 157.20-157.60 zone presents an attractive selling opportunity, characterized by the presence of an H1 order block and a significant fair value gap. If we observe notable rejection signals, such as one to two hourly red candles indicating selling pressure, we will initiate a sell position with a stop loss set above 157.90, targeting 100-200 pips. Conversely, if #USDJPY manages to close above 157.60-157.70 in H4 or preferably H1 candles, we can consider a quick buy targeting 100-170 pips. Patience is key in swing trading, as this trade may conclude on the same day or extend over 3-4 days.

Historic Long Opportunity Bigest Reversal Pattern ?!! USD JPY According to Head & shoulders on Weekly Time frame
Convergence On CCI
So Crazy Opportunity !!! we wil see it

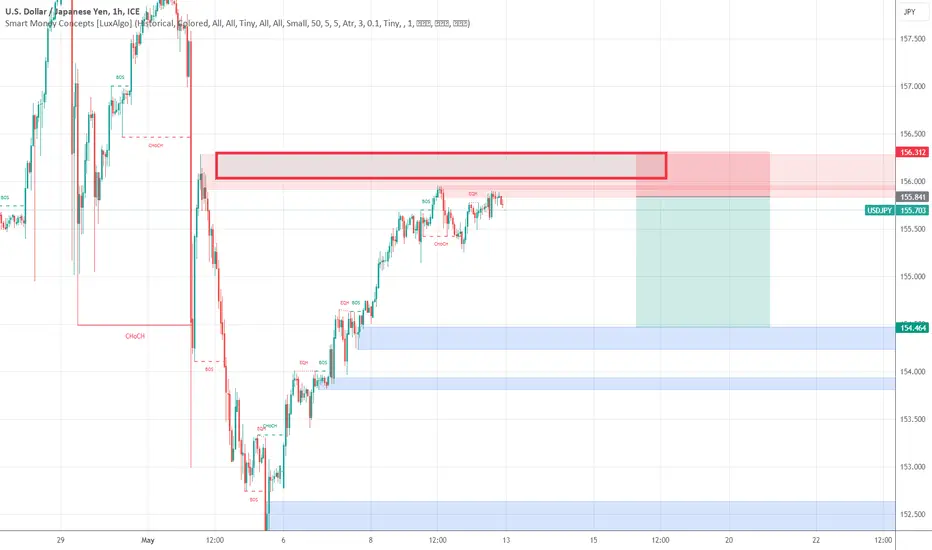
USDJPY Time to SHORT !
Its now right time for USD weakness and JPY strength - both Technical and upcoming Macroeconomic calendar indicators confirm the idea of stronger JPY against a weaker USD.
More important is lack of Macroeconomic events atleast for upcoming 1 week , which usally corresponds to Lower demand in USD.
The Area above in RED is the BEST shorting area ! with low tight stop and target no.1 at the dotted dashed line

View on USDJPY1.If DOLLAR goes to short we may see a huge drop on USDJPY.
2.If this major Resistance broken the next resistance is 177.
3.If the support zone broken the target1 is 147 and target2 141

USDJPY: Potential areas for further BOJ interventionsThese are the places where the Bank of Japan might step in to influence the market, but they won't announce it when they do. so be extremely careful as the price rapidly decreases

Selling usdjpy below 160 targeting 142.00-On this daily chart i see an interesting bearish big shadow that is sparking my interest in shorting uj.
-The big shadow, is a 2 candle-stick reversal signal where the trigger candle completely engulfs the previous candle.
-

No idea that goes as right as that Due to this buildup to historic extreme. No likely to continue above beyond.

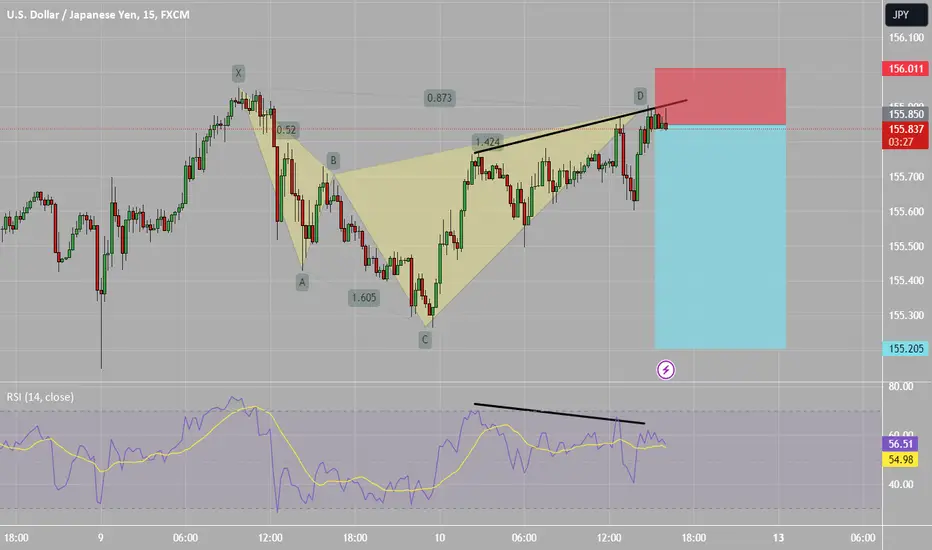
RR=4 sell ideaprice at resistance level + bearish shark pattern + RSI divergence ; price might reverse and retest 155.2
PS never risk more than 2% of your capital per trade