Top 40 invest head and shoulders looks exciting This inverse head and should is exciting. the question is how fast will the top40 get to the 7260c. the index need roughly a 23% rise to achieve this.
STX40 trade ideas

$STX40 Satrix40. Slow growth environment This is a good reflection of a very slow to no growth environment. If you remove the volatility the SA TOP share index have gone nowhere in the last 5 -6 years. The only way to make money in this type of environment is either very careful stock selection or investing for dividends only. Terrible investment environment.

So you think you top 40 then lets go all the way up Currently building my tax-free savings portfolio and Satrix top 40 is one of the ETF in my watch list. I think we might go down a bit before we go up. see series of my videos here www.youtube.com

$JSESTX40 Satrix Top 40 ETF - Top of channel resistanceThe Satrix ETF has now reached the top of the channel (pre COVID ) levels and I believe will experience some resistance in breaking out of this multi year channel. Take care in taking any new long positions.

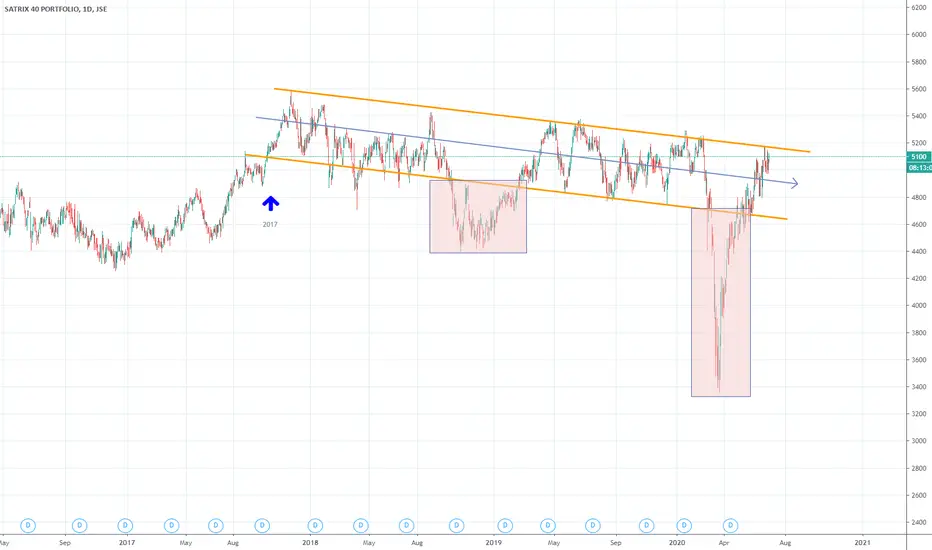
$JSESTX40 Satrix Top 40 ETF - Back into channelSince 2017 the Satrix TOP40 ETF has been moving in a channel with a downward slope. We have reached the top of that channel once again. The channel has only been breached twice in the three year period. The obvious assumption would be to believe that it will keep trading in the channel into the foreseeable future. Personally I think better ETF's with more foreign exposure and more possible upside exists.
#SATRIX40 ETF Tough time ahead for bullsThis zone indicated in pink between 48-49 is going to pose a problem for bulls going forward. It's going to take a lot of momentum to get through that area. Expect a lot of resistance.

STX40 - Monthly - Price has dropped below the kumo monthly support extending all the way back to 2008-2009
- Stochastic is still not overdone and the near dbl top targets the R35 area
-- MANAGE YOUR RISK - -
Disclaimer: All ideas are my opinion and should not be taken as financial advice.

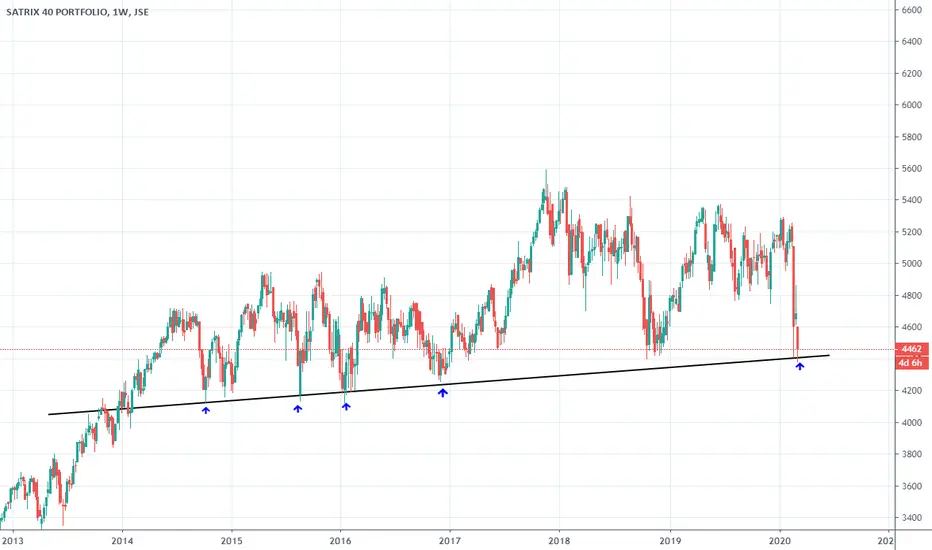
#Satrix40 ETF. Could we find some support here ?Trading on a long term support line. Could we find support in this volatile market and bounce off support ?
#STX40. Satrix40 ETF. On supportSartix40 is trading on support. If support breaks 4850 is the next stop.

SATRIX 40 - Bearish Engulfing candle- SATRIX 40 ended the week with a bearish engulfing candle (with volume)
- Looking for a move back to the 200ma for support


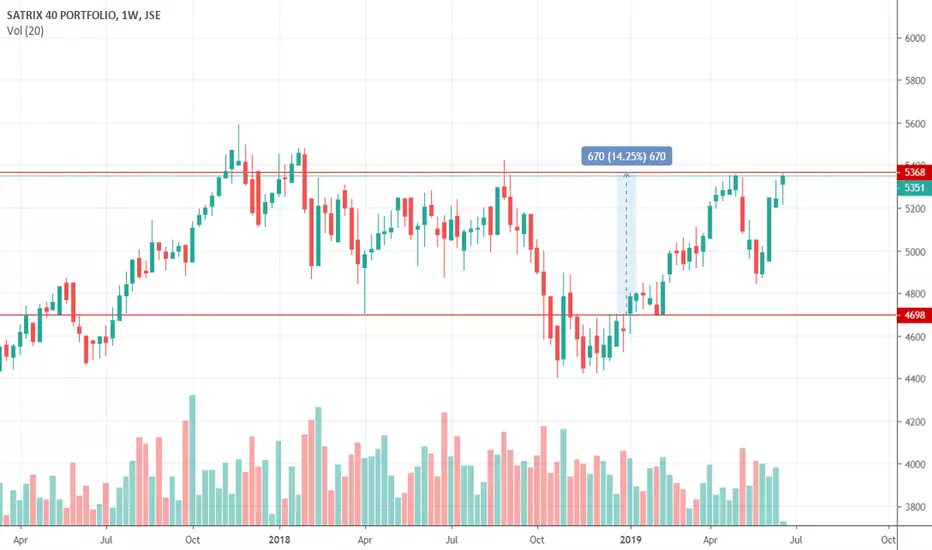
Satrix40 Performance year to date +14,25%Not a bad performance by the Satrix Top 40 ETF for the year till date.

STX40 - Next move pointing lower Cut my general market exposure and waiting on the sidelines for the next move - I suspect it will be lower. Gap close + rising wedge set up = bearish

STX40 8 RRR shortTrading Methodology:
1. An asymmetric bullish/bearish pennant is drawn using ascending and descending curved trend lines with a minimum of three price action touche points per line. The direction is determined by the previous trend.
2. The angle tool is applied from the earliest two trend touch points, beginning at the earliest touch point.
3. A trend-based Fibonacci retracement triangle is drawn starting from the earliest trend touch point and ending at the earliest touch point of the opposite trend line .
4. Based on the degree, of the earlier defined angle, the appropriate (and secret) levels are selected for the fibonacci retracement ; two levels for stop-loss and two levels for take-profit. The closest stop-loss level to the current price level is the top priority stop-loss. Though the secondary stop-loss level is often chosen for some markets such as FX and some equities in order to account for seldom unexpected resistance breaks. The greater target level is the top priority, and where majority of the shares are sold, though some may choose to close part of the position at the first target level or set it to be the stop-loss once price exceeds it. Entries should be laddered in around the levels closest of the yellow line.
This trading strategy can be applied to any market and time frame, and positions most often garner the greatest risk-to-reward ratio with the highest success rate. What more can you ask for? I will only be posting my unique trading strategy until EOY. I work solely with price action to identify pennants and apply unique trend-based fibonacci retracement levels for SL and TP levels. Reach out to me if you have any questions.
