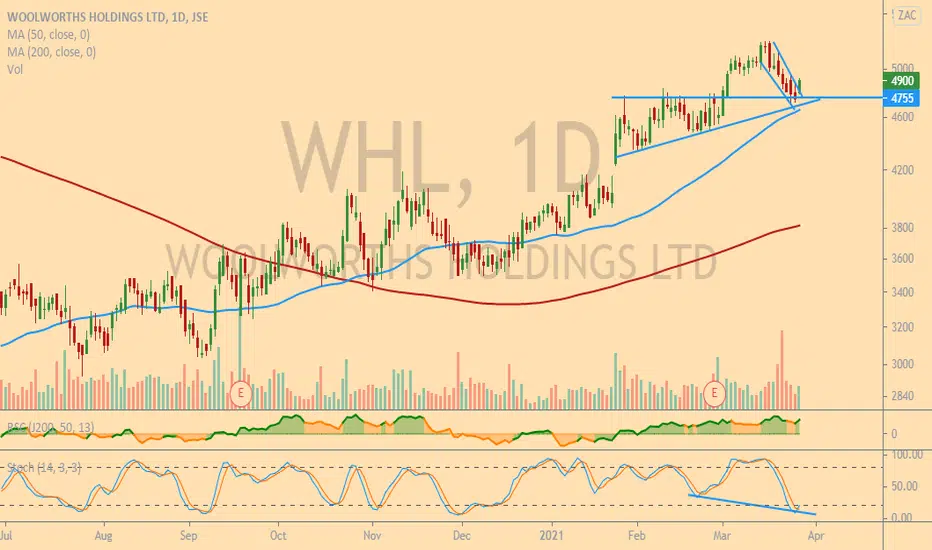
A nice Ascending triangle on Woolies
No position in the market.
Woolies seems to have turned the tide. The stock has been moving into higher boxes, and the 30w EMA has crossed the 60w EMA. The stock is looking good to break to the R47 - R57 box.
WHL trade ideas

Not a buy at just yet!Woolworths is a South African retailer that has struggled over the last few years starting with a purchase of the Australian retailer David Jones which took place in 2014 at a large premium to its intrinsic value. Woolies has since had to write down the value of its David Jones holding by around 60%. Ouch!
The company's current CEO appears to have a viable turn around strategy with a focus to improving their online sales. The question is, how effectively can they grow their earnings going forward?
The company has taken on a fair amount of debt compared to its historical debt levels, however, most of their debt is structured over a long period of time. This gives them time to improve their free cash flow over the next 3 -5 years. Their average annual free cash flow over recent years is around 4.5% - 5%, which isn't where share holder would want it to be.
The worrisome aspect for me is the fact that their effective interest on debt is around 8.5% per annum. To me that draws a line in the sand to say that they need to grow their earnings by at least 10% per annum.
Which could be possible under a favorable economic environment and a successfully implemented turn around strategy.
For the time being i wouldn't have the conviction to take a meaningful stake in the company.
Trading signal
For the time being the signals on the weekly chart suggest that the price may need to retrace further which could complete a head and shoulder pattern which i have shown on the chart. We should have confirmation on this in the next 1.5 - 2 months.
Please like and follow for daily posts on various asset classes. Please also share your views on the trading ideas and whether or not you find them to be of any value to you as a trader.
Please note, this idea is shared for educational and discussion purposes only and should not result in speculative investment decisions in any asset class.


Bounce off bottom of channelWoolies in a dip looks to have bounced and hopefully heading back up. Indicators are favourable.

Channel breakFInding so many of these channel breaks on the JSE, positive momentum given a nasty kick.

WHL - Ascending TriangleA close above R47.60 triggers long idea with a target of R52. Stop loss would be a close below R45 once buying signal has triggered.

WHL - 1W - WOOLIES FOLDINGI Am not a short seller. That in mind weekly stochastics overbought. Strong bearish engulfing candle at the top of rising channel where price is finding resistance. I would rather wait for retrace to bottom of the channel before considering entering a trade.

The tide is turning on WHLWoolies seems to be turning the tide and trending upward. Recetnly breaking into a higher box

Short Term Trade Idea - Short WHL Price action bearish in early trade. Struggling at resistance trend line / potential 'gap' close at 4158.
Current: 4564c
Stop: 4690c

WHL Analysis - extract from weekly report 01 - 05 February 2021
Woolworths (WHL, 4493c) |Resistance encountered at the upper boundary of the 10-month channel with the price retreating over the 3 sessions to Friday 29/01. Potential for a gap close at 4158c which would also be in line with the 21-Day EMA -ythis level may offer an intraday/ultra short term rebound accumulation zone. Daily Chart.


Woolies ChannelWoolies seems like it can turn at this support line, MACD and RSI about to turn, monitoring if it does.

Woolworths, something to think about. More educational than anything...
Many people would've taken this breakout earlier in the day which ultimately came back down and didn't close above resistance. When swing trading breakouts I like to enter towards the end of the day which gives me a better understanding of how the market is acting and what the volume looks like.
Also as with most JSE shares that are breaking out at the moment we notice they have run a fair bit so far and a lot of these breakouts may be in the over brought areas. I like to trade breakouts that have been building a base under resistance for a few days as indicated on the chart. At the moment if you missed breakouts you can look for retests of the original breakout in the coming days to enter.


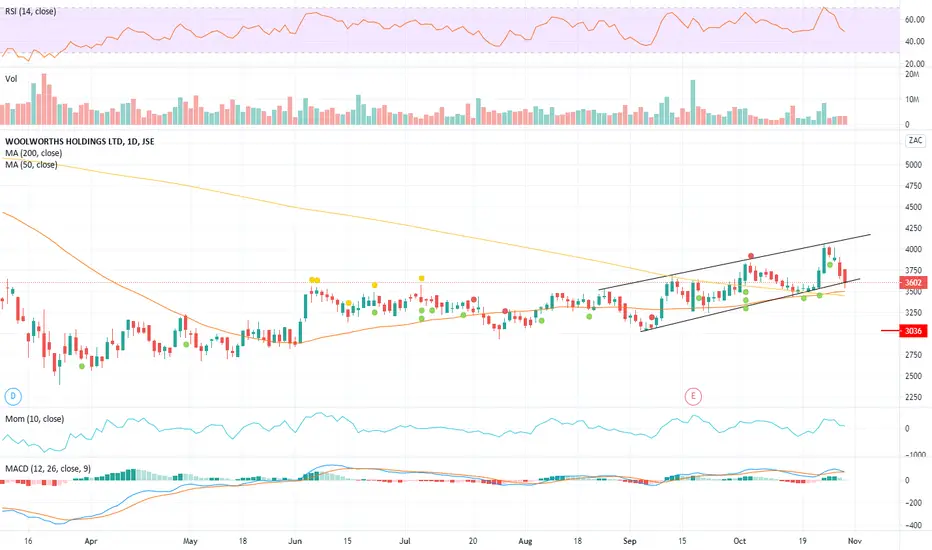
JSE:WHL - Rising trend still intact for now (D)JSE:WHL - First test of the rising support since 20 Oct
Failure to hold the 3600, we might see 3036
WHL - Bull FlagClose above R36 triggers long idea. Stop loss a close below R34. 1st target at R38 and full target at R42.


