KLAY on Strong trendline resistanceKLAY on Strong trendline resistance
Wait for Breakout and Retest or Rejection
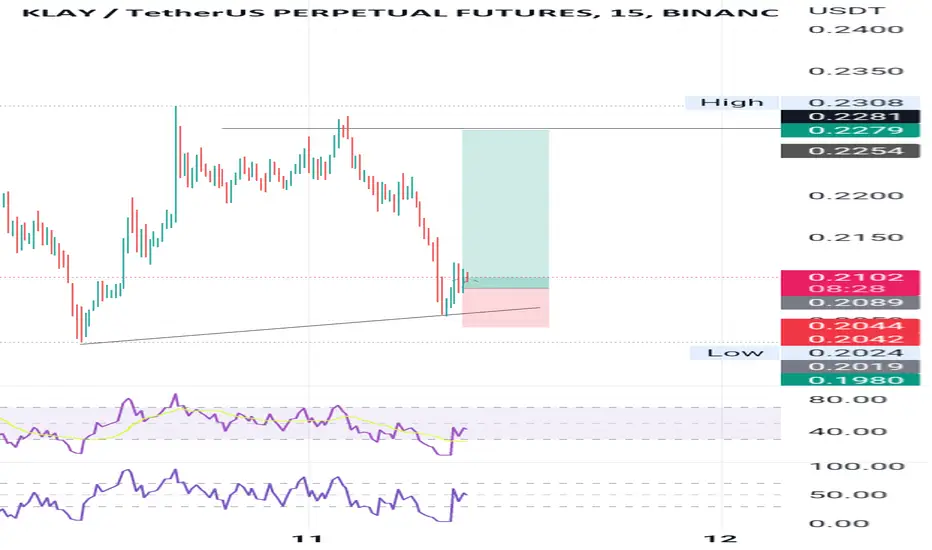
KLAYUSDT.P trade ideas

Two poi on Klay for both long and shortThe price is consolidating, there is a demand below and supply above. I expect price to tap on either of the two and react

Breakout on the horizon Breakout
watch for close above that trend line-
There's a lot of charts primed and ready.
This is one.

Seems like a Big up move sooner for this coinThe price is obviously hanging on a clear upward trend line and it is showing good momentum on lower Time frame , so it seems logical to me to long at this price

The basic way to buy...Hello?
Traders, welcome.
If you "Follow", you can always get new information quickly.
Please also click "Boost".
Have a good day.
-------------------------------------
(KLAYBTC 1W Chart)
0.0000 0938 ~ 0.0000 1297 The key is whether you can rise with support.
We need to see if we can dissipate the power of the uptrend while rising above 0.0000 1297.
-------------------------------------------
---------------------------------------------
(KLAYUSDT 1D Chart)
The key is whether the price can quickly rise above 0.2676 and sustain the price.
If not, I expect it to decline around 0.2216-0.2288.
In a downtrend, the important thing is not to fall below the downtrend line (1).
If it does not fall below the downtrend line (1), I expect a quick turn to the upside.
A full-fledged uptrend is expected to be possible only when it rises above 0.3980-0.4180.
Therefore, those who want to invest in KLAY coin in the mid- to long-term can take time to respond.
Among the basic buying methods, there are the following methods, so please refer to them to get good results.
1. If the price is below the MS-Signal indicator, buy when the candlestick on the 1D chart is a rising candlestick.
2. If the price is above the MS-Signal indicator, buy when the candlestick on the 1D chart is a falling candlestick.
Methods like 1-2 are most effective when trading a few hours before a new candlestick is created.
-------------------------------------------------- -------------------------------------------
** All descriptions are for reference only and do not guarantee profit or loss in investment.
---------------------------------

KLAYUSDTHello Crypto Lovers,
Mars Signals team wishes you high profits.
This is a 4-hour-time frame analysis for KLAYUSDT
R2 and R1 are the resistance areas in this chart with their representation of the disability of the price to rise at several points. S1 used to be a resistance line in the past. And S2 is a support line clearly that contains the support of price at various points. Therefore, the price had a kind of falling trend and it is reaching S1 after a little rise at the current point. By having its fall continued to touch S1, we will have a rise expected for it to reach higher amounts. Subsequently, we must wait for some confirmation candles to rise and an increase would be there for the price to reach R1 or by having more fixation over there, more rise is expected then. Also by giving us some falling signs at any points or through moving below S1, more decline is definitely will be waiting for the price toward lower amounts. Note that S1 and S2 are risky areas in order to put your trade orders. For enjoying less risky trades, we recommend you to obtain every piece of information and details through our analyses and updates.
Warning: This is just a suggestion and we do not guarantee profits. We advise you to analyze the chart before opening any positions.
Wish you luck

KLAYUSD: Right-Angled and Descending Broadening FormationThis is a Right-Angled and Descending Broadening Formation Breakout after a Partial Decline which makes the chances of performance even greater. For this one i would target the .618 Retrace though it could always go higher to maybe even an .886 KLAY may also be doing a bit of Break Hook and Go action on this pattern on this weekly timeframe.

This thing is about to drop!You could see the peak forming. I think it's about to start trending downward.

Klay trend break potential.I have a wicked short entry on klay @ .3255. It was hard to nab so averaged out a little lower than I was entering on.
The PA suggests that it will turn down. My entry is obv better - just watch for a retest and breakdown and ladder in if it holds. BTC will need to co-operate. NYSE market end you'll probably see PA.


Trading setup for a long opportunityIf the chikou span gets above the cloud then there could be a long trade opportunity with key levels for TP that could be :
0.1615
0.1635
0.1670

KLAYUSDTHello Crypto Lovers,
Mars Signals team wishes you high profits.
This is a one-day-time frame analysis for KLAYUSDT
There are R2 and R1 on the top which are our resistance areas and include the disability of the price to rise. And we have S1 which used to be a resistance area at the bottom. Therefore, we have the fluctuation of price over S1 area and we believe it will have its falling trend continued to the mentioned area and then via providing us some confirmation candles to rise, the long position of the chart is activated and an increase would happen for the price toward higher amounts like R2. Or possibly there would be a decline to lower amounts in case the price moves below S1. The point is if you are looking for wise trades and less risky ones, our suggestion will be following our regular updates.
Warning: This is just a suggestion and we do not guarantee profits. We advise you to analyze the chart before opening any positions.
Wish you luck

KLAY LONG SETUPHi, dear traders. how are you ? Today we have a viewpoint to BUY/LONG the KLAY symbol.
For risk management, please don't forget stop loss and capital management
When we reach the first target, save some profit and then change the stop to entry
Comment if you have any questions
Thank You

KLAYUSDT (1H) - Bullish breakoutHi Traders
KLAYUSDT (1H Timeframe)
The market is in an uptrend, and we are waiting for an entry signal to go LONG above the 0.1773 resistance level. Only the downward break of 0.1689 would cancel the bullish scenario.
Trade details
Entry: 0.1773
Stop loss: 0.1689
Take profit 1: 0.1823
Take profit 2: 0.1908
Score: 9
Strategy: Bullish breakout

KlayUsdtKlay Blockchain on this area good for buy and volume is high on history on this Entrypoint area
after little fix on entry can buy and wait but market now no more stable and BTC can again 1 time touch 15k
so wait on EntryPoint buying
GL
EntryPoint:
0.1615
0.1538
Supports:
0.1594
0.1335
0.1209
Resistances:
01826
0.1866
Targets:
0.2176
0.2458
0.2783
0.3317
0.4161
for mid time
0.5521
0.6422
0.7939
GL

KLAY IS VERY BEARISHHello, I hope you are well
We have a diagonal that I think we are in wave E. This wave E is similar to ABC and wave B is an inverted bearish contraction triangle, We are now in wave E of this triangle. Every position you open, don't forget to manage capital, volume and leverage, as well as set stops.
Comment if you have any questions
Thank you

KLAY PATTERN INSIDE A PATTERN INSIDE A PATTERN INSIDE A PATTERNKLAY POSSIBLE TRADE SETUP
Risk to Reward: 6% vs 22% ( Maybe 67% , with even 10x leverage that is around 670% )
Today I will show you guys a PATTERN INSIDE A PATTERN INSIDE A PATTERN.
Maybe even 1 MORE PATTERN INSIDE those.
I'm PRETTY SURE & HOPEFUL you will LEARN & EARN something from this post. This is gonna be a big post, so bear with me.
The 3 patterns are FALLING WEDGE , DESCENDING TRIANGLE and HEAD & SHOULDERS. And the MAYBE PROBABLE PATTERN is a BEAR FLAG.
In the first chart, we will see a DESCENDING TRIANGLE in 1D timeframe. Descending triangle usually means continuation of trend. Before entering the triangle , we were in a downtrend. Descending triangle's ideal breakout target is HEIGHT of the triangle.
2nd chart : We go to 4H timeframe. A possible HEAD & SHOULDERS pattern forming. H&S ideal BREAKOUT TARGET is the height of the HEAD.
3rd Chart: We see a BIG FALLING WEDGE which got rejected from the RTL and heading towards STL now.
4th chart: The probable BEAR FLAG and PROBABLE PRICE ACTION.
Now the INTERESTING part comes, you see the LOW OPACITY YELLOW possible pathway and DIAGONAL LINE? That's my probable path for PRICE. And the diagonal line is the breakout target for the BEAR FLAG. How do I get that?
If the H&S PATTERN plays out, it will BREAK DOWN from the descending triangle too.
Now at that target there is a strong ZONE SUPPORT. We are likely to see a bounce from there , if the bounce comes back to the DESCENDING TRIANGLE's current STL that will CREATE the PROBABLE BEAR FLAG. You can & should take SOME profit at descending triangle's breakout target and add margin when & if it comes back to CREATE the BEAR FLAG.
And that bear flag's IDEAL BREAKOUT TARGET is around the STL of the BIG FALLING WEDGE.
Everything ALIGNS like a charm right ? These are all just speculations & my thoughts only. The whole scene might take 1-2months to playout.
Entry zone: 0.1919$-0.1947$
SL: 0.2035
Use proper POSITION SIZING & take ENTRY IN PARTS to minimize risk.
Non financial advise. Trade at your own risk. Do your own research.


KlayUsdt Rdy for pumpklay blockchain is more dump and now rdy foor pump
market and BTC can save position and not again dump
klay can big pump but for best move need break resistance blue tren line
(guys you research after FTX and Luna we cant promis others project can save on bear market or not. before this we say this but again isay for u remember)
GL
EntryPoint:
0.1668
Supports:
0.1475
0.1336
0.1210
0.1050
0.0877
Resistance: (now on first resistance)
0.1895
0.2209
Targets:
0.2500
0.2829
0.3374
0.4222
Midtime:
0.5616
0.6517
0.8072
long time:
1.2046
1.6021
2.3027
HODL:
3.4364
4.5704
GOAL:
6.5690
GL

Trading opportunity for KLAYUSDTBased on technical factors there is a Buy position in :
📊 KLAYUSDT
🔵 Buy Now 0.1899
🧯 Stop loss 0.1670
🏹 Target 1 0.2420
🏹 Target 2 0.3080
🏹 Target 3 0.3600
💸RISK : 1%
We hope it is profitable for you ❤️
Please support our activity with your likes👍 and comments📝

Klaytn (KLAY) - November 29Hello?
Traders, welcome.
If you "Follow", you can always get new information quickly.
Please also click "Boost".
Have a good day.
-------------------------------------
(KLAYBTC 1W Chart)
In order to gain the strength of the rise, it must rise at least 0.0000 1297.
-----------------------------------------
(KLAYUSDT 1W Chart)
The key question is whether it can rise above 0.3426.
(1D chart)
The question is whether it can break out of the downtrend channel.
To do so, we need to see if we can get support around 0.1718 and rise.
If not, I expect it to decline to around 0.1474.
-------------------------------------------------- -------------------------------------------
** All descriptions are for reference only and do not guarantee profit or loss in investment.
** If this chart is shared, you can use the indicators normally.
** The MRHAB-T indicator includes indicators that indicate points of support and resistance.
** HA SRRC indicators are displayed as StochRSI (line), RSI (columns), and CCI (bgcolor).
** The CCI indicator is displayed in the overbought section (CCI > +100) and oversold section (CCI < -100).
(Short-term Stop Loss can be said to be a point where profit or loss can be preserved or additional entry can be made by split trading. This is a short-term investment perspective.)
---------------------------------

Klay scalp trade for next few daysBINANCE:KLAYUSDT
Local trade for Klay
Possible Targets and explanation idea
➡️This local trade for next few days not middle term
➡️Got confirmation on 4H signal to buy on "Direction" indicator.
➡️Take profit signal by "Trade On" and 2 new scalp signals to sell.
➡️Possible target 0.1644 to open long with stop loss 0.1594 (3%)
➡️37% profit and close position at sellers zone 0.2254$
Hope you enjoyed the content I created, You can support with your likes and comments this idea so more people can watch!
✅Disclaimer: Please be aware of the risks involved in trading. This idea was made for educational purposes only not for financial Investment Purposes.
* Look at my ideas about interesting altcoins in the related section down below ↓
* For more ideas please hit "Like" and "Follow"!
