Uptrend Was having nice momentum in a uptrend but Dropped like everything thing else today but supports lines (Gold lines) held.. Next targets are green lines.
0A44 trade ideas

$JMIA Breaking to New Highs!Great story on this stock. The $AMZN of Africa? You can see my entries on the chart. I'm looking for this to possibly be a monster stock. TBD, but it's strong right now.


JMIA more room to run
JMIA broke through PT 1 and is heading to its PT 2 of 51.73 if momentum continues that will set off a rocket to PT 3 of 68.27!! JMIA had a perfect consolidation period and triggered off the 0.5 fib line of 33, I originally had it trigger of the next fib up of 34.98 close enough. JMIA should continue its upward trend, RSI is climbing but not at extreme levels yet! Long term JMIA will be triple digits!


Above $39 for $JMIA is a retest of the highs at $50Above $39 for $JMIA is a retest of the highs at $50

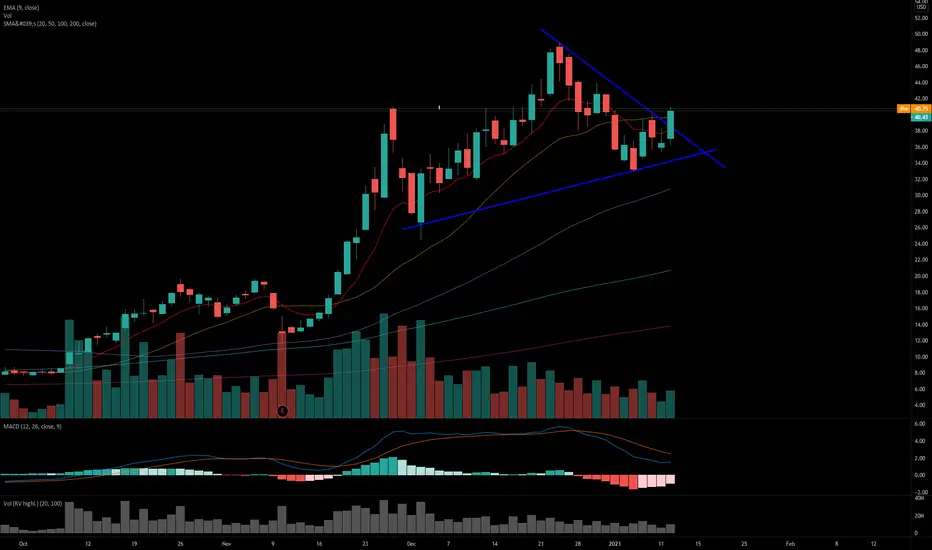
Pullback before trend continuesI'm short JMIA based on the ascending wedge pattern formed on the daily charts.
Daily (Bearish)
1. I anticipate pull back to the mean average ($30), which is also the quarterly EMA.
2. Bearish Volume
3. Bearish Momentum
Weekly (Bearish)
1. Bearish engulfing candle on weekly chart.
2. Bearish volume.
3. Bearish momentum.
4. Bullish Cup and Handle Pattern may form in the coming weeks.
Happy Trading!
Disclaimer. My ideas are for informational purposes only. My ideas do not constitute solicitation, recommendation, endorsement, or offer to buy or sell any securities or other financial instruments. You should not construe any such information or other comments as legal, tax, investment, financial, or other advice. There are risks associated with investing in securities. Investing in stocks, bonds, exchange traded funds, mutual funds, options and money market funds involve risk of loss. Loss of principal is possible. Please exercise your own due diligence.

$JMIA All Targets Hit! Next Stop $100? Thanks Citron!Video Breakdown on $JMIA going into 1/14! Amazing day! Check or last $JMIA breakdowns!


JMIA jmia bullish once again after long consolidation and high volatility from the cup and handle pattern. price target $80 to $100

JIMA LONG - TRADING IDEAPutting in a base starting back from its IPO in APRIL 2019 - Could go higher here


JMIA 08-01-2021 LongAsset and Time frame - JMIA,1H
Entry Price -37.85(For a safer entry wait for the hourly candle to close bullish)
Exit(Stop Loss) -37.42
Exit(Take Profit) -49.69
Technical Analysis -Price rebounded from the 4H Fibonacci level of -0.272, we have a major volume spike and the crossing of both MA, including on the 4H chart, on the daily chart the RSI hasn't crossed the 40 line, and right now on the premarket, price is sitting on a significant daily level
I would like to hear your opinions and what can I do to improve, many thanks


This is the next amazon, get in before 1000trendline support that held last time, good spot to add shares or maybe even calls imo, be careful with size on calls since IV is usually very high. congrats to everyone still holding shares from under 13:) still looking to sell over 100!


$JMIA Jumia Tech C&H Bullish Pattern
As we suggested on our previous post , investors should be aware of the possibility
of a pullback before breaking to new highs, which would result in the formation of a C&H bullish pattern.
The selling may have stalled for 2 reasons.
The correction hit the Fibonacci Golden pocket.
The stock hit a perfect 1-2-1 Fibonacci extension.
Reversal Targets
$36.27 Daily candle resistance
$39.26 20ma and candle resistance
