0A44 trade ideas

Trendline - on demand zone Jumia have rebound on the trendline from early 2020 on the previous top at 18 where is the demand zone.
There is an harmonic bullish Crab right before giving a bullish information we can imagine a first target around 30$ for around 40% gain

$JMIA - may be reverse point$JMIA - Technically, the paper pushed off the trend from March 2020. If it exits the wedge, it could shoot up. In case of exit from the wedge, growth targets $27.5 -> $33.5
It's my personal opinion and is not investment recommendation.

JMIA LongWonder if we can hit those stops, above second line is the first stop most obvious level, if we can cross that level we might get momentum. If we cross previous week open we may also target august open by september.
Not a recommendation, is just an idea I had.

Jumia Ready to run.So right now were very very oversold, its come down to Fib level and a massive support level. its formed a cup and handle and a falling wedge. its poised to run africa which is a continent thats 10 years behind America. This to me is like buying amazon back in 2008. China will likely be involved i mean its a BUY and HOLD no doubt

Jumia Technologies $JMIA - Bullish idea 💡 ⚠️ This idea is based on my technical analysis only. Do your research and trade on your own risk!

watching $JMIAAn overhyped stock, dubbed to be one of the "$AMZN wannabes" cohort. We see absence of buying pressure on the daily and weekly chart (no green bars). This implies no interest in buying dip, the last green bar seen had its low broken --> dip buyers got hurt.
However we see it printing the daily 9 and sequential 13 and potentially a weekly 9 next week. Demark indicators are great at signaling selling exhaustion TIMING, although needs to be confirmed by price movement. I use these High-Low-Close bar and a coloring rule based on percent change and golden ratio to be my confirmations.
I want to see green bar daily printed and have its high broken. Ideally by more green bars.

$JMIA - In the buy zone!Bouncing strong off its debut price of $17 as major support I'm taking my shot today with entries below $18/share
Stop loss with a close below $16/share
Target 1: $22 (+25%)
Target 2: $25 (+40%
Target 3: $31.50 (+75%)
Target 4: $41 (+125%)

JMIA daily FibDont know if I am even doing this right but is this how you would look at potential downside PT zones using fibs

JUMIA on watchlistBack in a very good price range, now we have to look out whether we resume the trend back up.

$JMIA Time to WatchJumia is an interesting stock and was a pennystock until they got new management while back. It has recovered, but now it's markcap shows it returning back into a pennystock. At current levels I see an opportunity that you may want to build a position.
News
-Missed on ER, but they have 600mil in cash
TA
-Since I been watching, Jumia has about a 7-8% downside to $17.66 which was resistance back in Aug-Nov 2020. Next point of interest is 28.07 bringing a 45% unside move.
-RSI is oversold leans bullish
-MACD is still bearish and leans more bearish
-Below the EMAs, which is bearish but could have an upside of 7% to try and turn bullish again.
-High vpvr levels at $22 area
Final Thoughts
Overall it's a stock I would buy on speculation, but I'm in ASTR atm so I'll be watching it closely while I look for another trade after I make my gains in ASTR. Jumia has major investors supporting it and its a bet on the African Economy, so maybe do some research on Africa of Covid19 and see how much is being impacted. For myself I don't hear anything about Africa on this matter, so its one piece of news I'm unknown on. Overall I told my friend before it crashed it would hit $50, but now with its MC below $2bil I think its a major steal with a massive upside protentional by years end and maybe the short term.

JMIA - Break through the channel on DivergenceHello everyone,
I hope you are all doing well!
As we may see, we have Divergence while on resistance of the channel that we have formed, which we are most likely going to break.
The Take Profit is sitting at $40.
Have an amazing day!

JMIA MOON COMING?!Earnings out tmr before market opening and the chart looks great so let's see :)
GOODLUCK!

Beaten down JMIA potential reversalJMIA had dipped into the loading zone but, It has also kept itself in a falling wedge. A typical bullish pattern, watch for break forward.


ready for some upside after creating a higher low?JMIA puts had a nice return if you secured! added some shares with profits from puts around 21-22. clearly making a higher low and ready for a little upside. conservative pt of 25 in short term with a bullish market. goodluck ! dont forget to like and follow for more :)

$JMIAGartley harmonic pattern.
4hr classic bullish divergence on the MACD. 4hr RSI is only at 33. Weekly hidden bullish divergence developing on the MACD and RSI too.
Stop = Below support/gap fill
Target = Resistance / C point of harmonic.


Bullish on Jmiajmia is a solid company not really making money yet but again solid as it gets in south africa. stock has been down but i wouldnt say over sold i just think its priced correctly but here we are on the yearly where things get harder for traders because there looking for patterns frrom weeks or months ago and now yearly and i think if we can break out this tim we got some moon juice on jmia !

JMIA downtrend here? be careful longs! hello everyone please leave a like and follow if you enjoy my ideas ! JMIA is entering a bearish downtrend channel on weak volume, all we need is some bad news/earnings and we test TP 2 of 18.5! ill be looking for long entry at 13-16 area. goodluck :)

$JMIA C&H On The WeeklyJumia shares have formed a massive C&H pattern. It is my current belief that the 50% retracement will act as support here and we will see a breakout of this handle in the upcoming months. Also note that today's candle touched to the anchored VWAP from the IPO, which is another bullish sign. Like always, watch out for a break to these levels as a bearish indication. Good Luck!

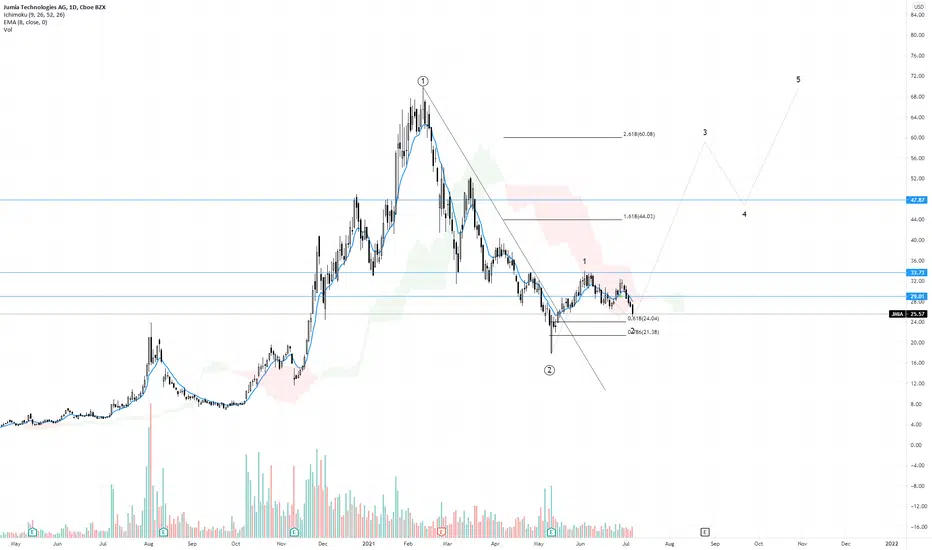
UpdateWell we dropped to our previous thoughts of where this correction can take this to. We are not done with Wave 2 yet. Let is bleed for few days, until we see some bullish price action.
JMIA Falling Wedge 7/7/21JMIA is setting up for a bullish breakout. Entry on breakout to the upside.
Upside targets are:
$40; $45; $50; $68 (ATH)
Stop loss if it breaks back into wedge following breakout
