FAST Gaps to Previous HighHigh Frequency Traders triggered on FAST news, gapping the stock just slightly above the previous yearly high. The stock is in a slight run upward within the previous white candlestick body. The gains look to sustain.
0IKW trade ideas

Congrats to Subscribers! Fastenal up over 15%It is very easy to read price action if you have a reference point. These support/resistance lines are there to help you read where the buyers and sellers are likely to make a stand.
MasterChartsTrading Price Action Indicators show good price levels to enter or exit a trade.
The Blue indicator line serves as a Bullish Trend setter.
If your instrument closes above the Blue line, we think about going Long (buying).
For commodities and Forex, when your trading instrument closes below the Red line, we think about Shorting (selling).
For Stocks, I prefer to use the Yellow line as my Bearish Trend setter (on Daily charts ).
Be sure to hit that Follow button! Please find me on social networks via the link on my profile page for more ideas from MasterCharts!

Fastenal hits all time highEntry level $36.40 = Price target $40 = Stop loss $35.80
Bullish earnings and a change in market sentiment has sent FAST to an new high, we see $40 as the next target.

$FAST Fastenal Jumps on Sales Beat Simply a buy and is on the way to all time high.
Yield 2.84%
P/E ratio 23.24
Short interest 6.94%
Company profile
Fastenal Co. engages in the provision of fasteners, tools, and supplies which can help in the manufacture of products, build structures, protect personnel, and maintain facilities and equipment. It products include cutting tools & metalworking, fasteners, material handling, storage & packaging power, transmission & motors, tools & equipment, electricals, abrasives, hydraulics & pneumatics, plumbing, lifting & rigging, raw materials, fleet & automotive, welding, office products & furniture, janitorial and lighting. The company was founded by Robert A. Kierlin, Michael M. Gostomski, Henry K. McCannon, John D. Remick, and Stephen M. Slaggie in November 1967 and is headquartered in Winona, MN.


FAST: Steep rise, overextended indicators = profit-taking riskFAST moved out of its sideways pattern and gapped, then ran up to a new all-time high. The stock is at risk of profit-taking due to the angle of ascent of the price action and the overextended technical indicator patterns.

FAST OverboughtOverbought before earnings, now it's just ridiculous. Expecting a pullback this week, April 18 puts are cheap though risky.
Small play.

Fast #FASTBreaking new highs
Over extended , expecting bigger retracement . Looking to go long if price drops to the origin of the move at around 55 dollars a share.

6 Years of consolidation giving wayI can't say I'm favorable on the broad market risk reward at these levels, but there are certainly some bright spots. Buyer stampede in this one after a respectable earnings report. To boot, potentially some infrastructure bill front running.


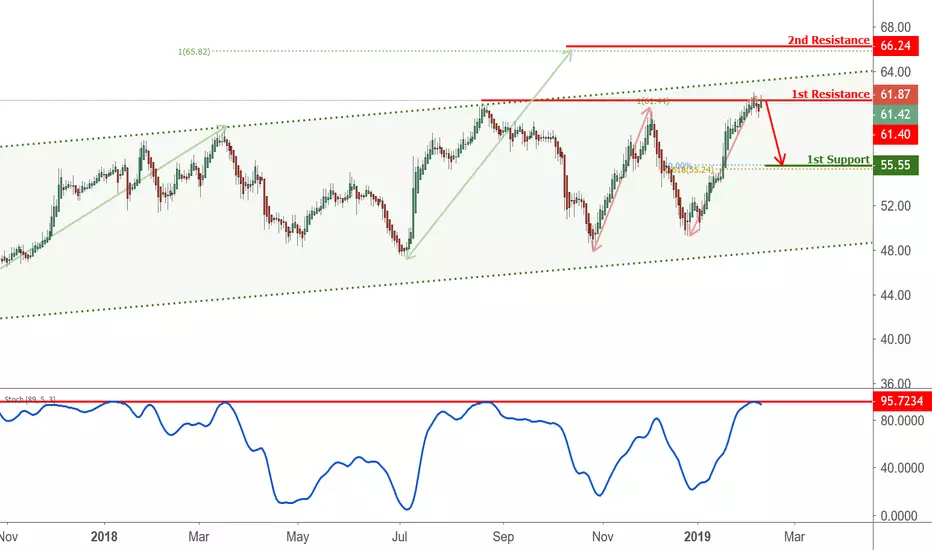
FAST approaching resistance, potential drop! FAST is approaching our first resistance at 61.40 (horizontal swing high resistance, 100% Fibonacci extension, ascending channel's resistance) where a strong drop might occur below this level pushing price down to our major support at 55.55 (50% Fibonacci retracement, 61.8% Fibonacci extension).
Stochastic (895,,3) is also approaching resistance where we might see a corresponding drop in price.
FAST ShortShort based of channels and fibs
My Planned Entry: 61.24 (any entry above this is fine)
Stop Loss: 64.00
PT: 51.00 area
Risk/Reward: 1:3

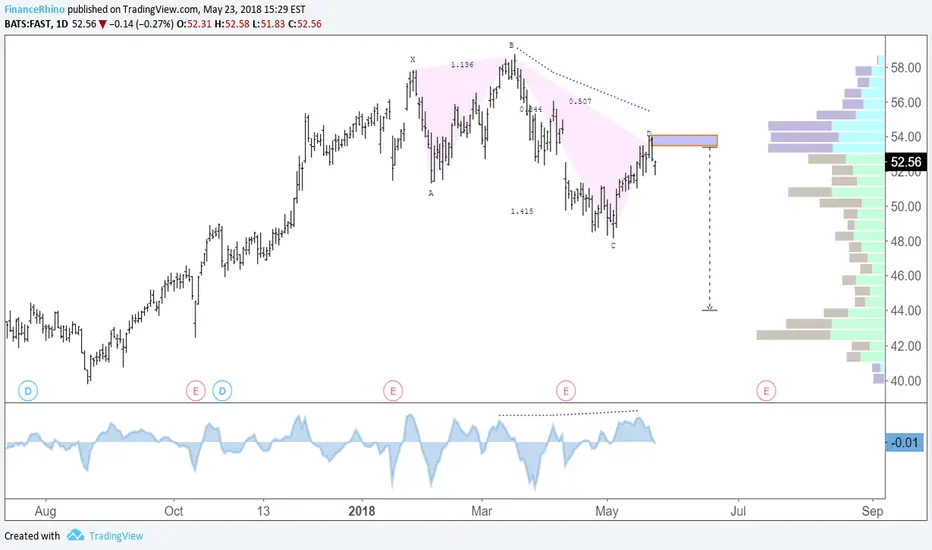
Kangaroo tail on FASTWhile we wait for that huge head&shoulder to complete and go short, the right shoulder is giving us another nice signal with the formation of a kangaroo tail. Both the promise of the major pattern completion and the tail gives me enough confidence to open a trade at my standard risk %. This time I'm using channels to calibrate stop loss and take profit. SELL STOP @ 55.02, STOP LOSS @ 56.02, TAKE PROFIT @ 53.13

[FAST] Phase 3 -> phase 4Theoretically the share is in phase 3, but when the price break the support, it will be in phase 4. You see the price is below to 30MM and the 30MM is starting to had a negative slope. Don't buy!


FAST Earnings - BearishFAST, big gap up on the last ER. just touching the trend line, all the ma's pointing down. Earnings on Wed premarket. Looks bearish at the moment, can fill the gap to 50.
The sell volume on the last 2 days is 1.5 times the average, not a good sign before earnings.
Price increased only in the last ER out of last 5 ERs. Generally decline or no change within a day or two.


FAST. SHORT IT TO THE GROUND! (FAST is the name...)Boy I hate using metrader on the phone. Well it's not that bad on the S9+. I just hate the autoscreen, same on TV it scales auto every time you open a new chart.
I don't know how high it could get before going down, if it goes down.
I feel bad taking advantage of investors losing money HAHAHAHA just kidding hope it falls hard, while it does I will try finding a few bagholder quotes for a good laugh.
Inb4 stop lossed in 30 minutes.


Survivor of the biggest point drop In History #2 (FAST)Five years and seven months took the price to break that key resistance line around 52.40
Now there are a pullback in progress to try to fulfill that the old Resistance becomes Support.
