0JJC trade ideas
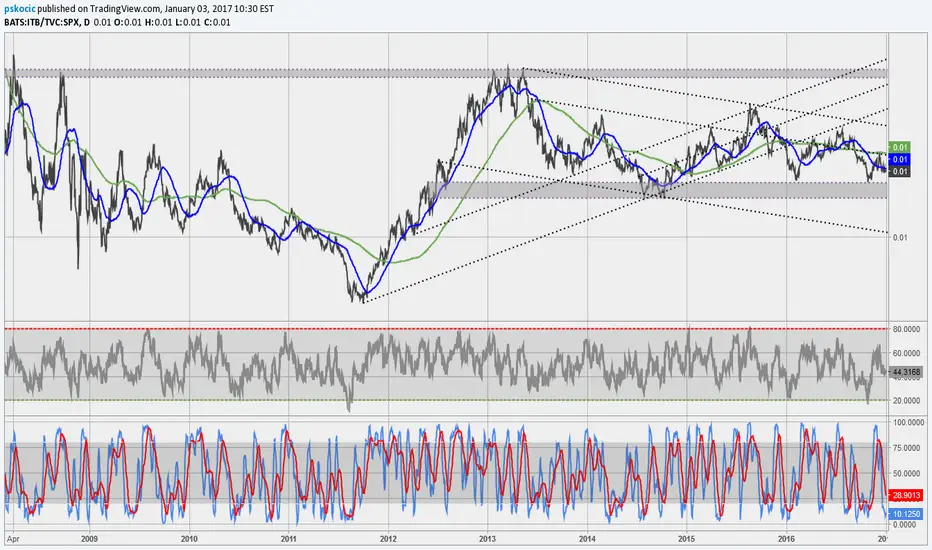


ITB - Down Bevor UpA nice and clean zoom of the centerline to the upside.
But I expect a retest of the centerline.
From there I would like to go long...unfortunately there is no good stop for a directional play - means, I go with a options strategy (RiskReversal/ PutSpread).
Resistance at the prior breakout/zoom level (orange).
Patience...always have to be patient.

ITB monthly - bounce or die - 10/27/2016We will see if we have a case to short ITB by end of year or early next spring.

IT CAN'T be this clear!?ITB short on speculative housing bubble. Chart shows a HWB (50% Fib Retracement)
Inside on smaller time frame 4hr/1day You can find a bearish head and shoulders.

ITB weekly - long term support broke this week - 1/8/2015It broke both blue supports this week. Red support may come into play next week. Also it might work on its right shoulder.

ITB monthly - appears to be topping - 12/11/2015It falling out of its rising wedge with RSI diverging for quite some time. Might be a short candidate but we will wait a little longer for assurance (housing sector). Note RSI falling off and a negative MACD.

ITB, RSI resistance could be a keyHome construction ETF has made three attempts to break the 26.67 resistance.
Though RSI is showing a potential divergence, rejection by RSI trendline could see this ETF collapse while a break of RSI trendline will definitely see more upsides.
Stay tune

ITB watch - buy candidateSTRONG buy if it breaks out on the monthly chart (on a monthly close). RSI and MACD still have to do some catch up. May retest pink line.

ITB - housing market rolling over?If using ITB as a proxy for housing market, it appears to be rolling over. If that is the case, how long and how high can Home Depot stand?

Unsurprisingly (see $LEN $PHM $TOL et al) Setting Up PotentialTop After April's Rising Wedge Breakdown. $XHB

Home-builder Stocks Could be Signaling Problems In 2014 Traders and investors will look at many different leading stock indexes and sectors for clues to what the economy will do. For example, there are many traders that will strictly follow the transportation sector as a leading indicator. After all, if the transportation stocks are rising, that is a good sign that the economy is growing and expanding. Over the past 20 years there has really not been a better leading indicator than the home-builder stock sector. This industry group has been one of the best tells for the economy, and I believe that still to be the case.
The leading home-builder stocks have been one of the best performing sectors since October 2011. In 2013, the home-builder stocks basically stalled out and traded sideways in a range for most of the year. This important stock sector remains very range bound even at this time. Traders must take note, if the home-builder stocks are unable to break out to new highs over the next couple of months, it will be viewed as a sign of weakness and a breakdown in the sector is very likely.
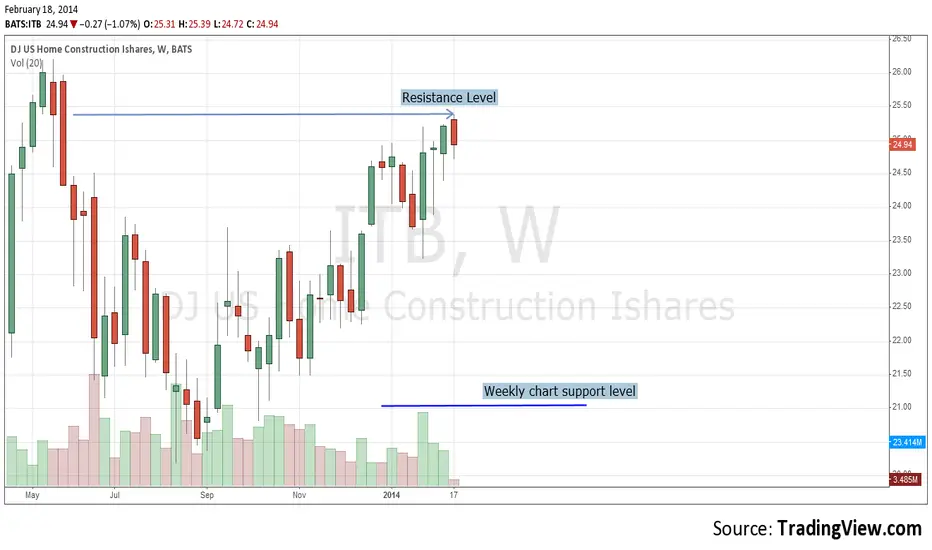
Some of the leading home-builder stocks that traders should follow include, Toll Brothers Inc (NYSE:TOL), Lennar Corp (NYSE:LEN), D.R. Horton Inc (NYSE:DHI), and KB Home (NYSE:KBH). Traders and investors that want to follow the entire sector can follow the iShares U.S. Home Construction ETF (NYSEARCA:ITB).
Currently, the ITB is trading around the $25.00 area. The ITB is now trading into very good weekly chart resistance. Should a pullback occur the ITB will have solid weekly chart support around the $21.00 level. Unfortunately for the stock market, any decline down to the $21.00 area on the ITB would signal some problems for the U.S. economy and most likely the stock market.
Nicholas Santiago
www.InTheMoneyStocks.com