SPY short hunt is ontoday is still early and will say next week for real signal but will put on a few puts today
0KZC trade ideas

Let see if SPY bulish tomorrow June 3 (?). Disclaimer: This is for study purposes only and does not constitute financial advice. You are responsible for your own trading risks.
Observations :
Volume Profile:
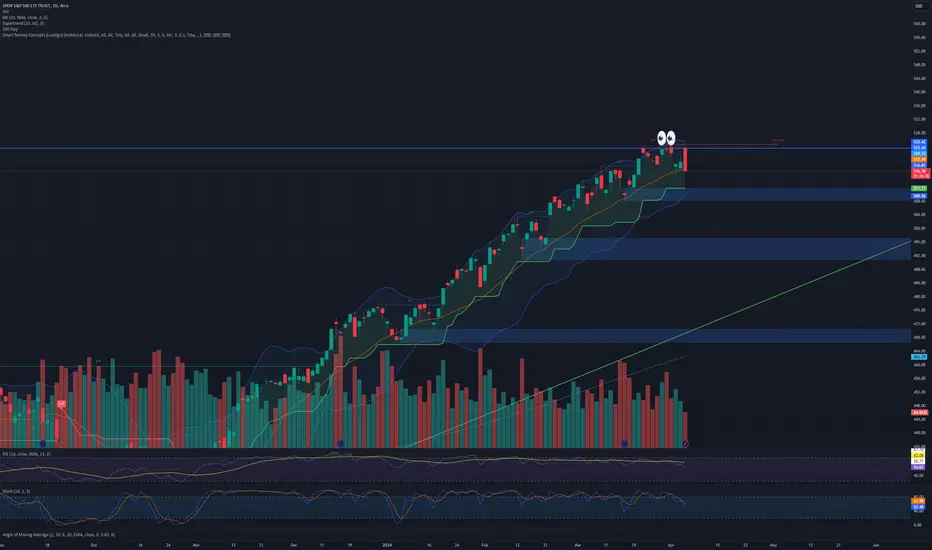
Point of Control (POC): Near $522.
Value Area High (VAH): Around $528.15.
Value Area Low (VAL): Approximately $518.36.
Trend Analysis:
There was a significant downtrend followed by a strong upward breakout from a falling wedge pattern, indicating a potential reversal.
Support and Resistance Levels:
Immediate Support: Near the POC around $522.
Immediate Resistance: Near the VAH at $528.15.
Further Resistance: Around $530.50.
Moving Average Convergence Divergence (MACD):
The MACD lines are below the histogram, showing a recent bullish crossover, which typically suggests upward momentum.
Trading Suggestion for Tomorrow:
Given the strong breakout from the falling wedge and the bullish momentum:
Bias : Bullish
Bullish Scenario:
Entry Point : Look for entries around $525, if it pulls back towards the support level or continues the upward momentum.
Target Levels:
Short-term Target: $528.15 (VAH).
Next Target : $530.50.
Stop Loss: Place a stop loss below $522 (POC), to limit downside risk if the breakout fails.
Bearish Scenario:
Entry Point: If there is a rejection at $528.15, consider short positions.
Target Levels:
Short-term Target: $522 (POC).
Next Target: $518.36 (VAL).
Stop Loss: Place a stop loss above $530.50, to manage risk if the resistance breaks.
Conclusion :
The chart shows a bullish breakout with significant volume, indicating a strong potential for upward movement. Trading in the direction of this breakout while monitoring key levels (support at $522 and resistance at $528.15 and $530.50) can be a prudent approach. Adjust stops and targets based on intraday price action and market sentiment.

S&P500 ETF Trust (SPY) Fell 0.55% Today is the Bullish Run Over?Economic indicators are crucial for policymakers, advisors, investors, and businesses to make informed decisions regarding business strategies and financial markets. In the week ending May 23, the SPDR S&P 500 ETF Trust (SPY) fell 0.52%, while the Invesco S&P 500 Equal Weight ETF (RSP) was down 1.75%. This article examines three indicators from last week — existing home sales, new home sales, and consumer sentiment. These data points provide an update on the current state of the housing market and consumer attitudes about the current and future strength of the economy.
Existing home sales fell for a second straight month in April as elevated mortgage rates and increased home prices continue to weaken demand. The median price for an existing home sold last month was $407,600, an all-time high for the month of April, marking the 10th consecutive month of year-over-year increases for existing homes. New home sales fell 4.7% in April to a seasonally adjusted annual rate of 634,000 units, falling short of the expected 677,000 units. April’s sales are 7.7% below what they were a year ago, marking the first annual decline in over a year.
Consumer sentiment fell to its lowest level in six months, according to this month’s final report for the Michigan Consumer Sentiment Index. The Michigan Consumer Sentiment Index is a monthly survey measuring consumers’ opinions with regard to the economy, personal finances, business conditions, and buying conditions. A closer look at May’s report revealed that consumers are concerned over the labor market, high interest rates, income growth, and inflation.
The outlook for the stock market's most important driver just keeps getting better. S&P 500 earnings grew 6% in the first quarter from a year ago, according to data from FactSet. When excluding dismal earnings from Bristol Myers-Squibb (BMY), the results were even better, with earnings growing 10%, per Bank of America. Consensus now sees earnings growing 11.4% in 2024, up from a projection of 10.9% on April 5. In 2025, earnings growth estimates have moved up to 14.2% in 2025 from the 11.6% growth seen that day.
On Tuesday, UBS Investment Bank US equity strategist Jonathan Golub boosted his year-end S&P 500 target to 5,600 from 5,400, citing "stronger earnings." This trend is supported by further market upside, as economic "tail risks" have declined, with consensus estimates for economic growth increasing throughout the year. Deutsche Bank's chief global strategist Binky Chadha recently told Yahoo Finance that further growth than expected in the economy could help the S&P 500 reach 6,000 by the end of the year.
Technically, the S&P500 ETF Trust index price charts depicts the ending of the 5th wave Bullish Divergence pattern which resonates with Elliot Waves theory. The Relative Strength Index which sits at 58.60 signifies weaker growth from the consumer Index.

SPY evening star setupFor those of you who understand candlestick patterns, this is not news to you.
The weekly SPY is setting up an evening star formation. It's a bearish setup on a weekly chart. More importantly, it should be noted as a false breakout (if we close near current levels)

SPY levels - Time to be patient Let's quickly review some levels in SPY.
I can see potential support at 525 as a base flip level.
523 also looks like support - here are 21 EMA + the flag bottom + gap fill.
The obvious resistance here is 532-533.
One key thing I want to mention: the market is now ranging, and it's important to be patient and give it some time to form clearer price action and confirm the next momentum.


The Mechanics Of Trading - Part IIPart I
I started this video because a friend asked me for help determining trends on multi-interval (time frames) and asked how I look at trading across multiple intervals. Asking how to best setup/use price trends to capture the best trade setups.
Essentially, it comes down to three key components...
A. Initial reversal/impulse waves should be traded lightly (if at all). They are the "potential price reversal setups" that are usually the most dangerous for traders (and often fairly short in length).
B. Looking for the second wave to form provides traders with the opportunity to catch the bigger Wave-3. This wave forms after the impulse (Wave-1) and a corrective wave (Wave-2), which must stay below any previous ultimate high or above any previous ultimate low.
C. Wave-3, and Wave-5 if applicable, are where traders can flex their muscles related to trade size using the techniques I present to try to capture the MEAT (Sweet Spot) of any trend.
Remember, after Wave-3, you must prepare for the potential end of a trend setup where volatility is likely to increase and risks become a bit more elevated.
I go over multiple techniques in this video.
Fibonacci techniques and Fibonacci Price Theory
Anchor Bars (breakaway bars)
Using Fibonacci Retracements to identify key support/resistance levels for trending
Stochastics
RSI
Wave formations (ZigZag)
and Others
This video is designed as an instructional video to help you incorporate usable techniques into your own trading style.
Hope you enjoy.

The market is taking a breakLooks like the market is going to make another visit to the uptrend line from October 2023. Be ready for a bumpy ride in the next couple of weeks. Save some cash for the right moment to buy or short something. We are still on a bull market.

$SPY Triple Top...AMEX:SPY getting spicy here, looks like a triple top for now headed into a lot of world news, ie Iran/Israel/Biden ... I think we've been overdue for a correction, this is a VERY solid base to start a downtrend and fill some gaps before heading back up for Trump Presidency... Buy the rumor stuff...
No positions, will look for continuation tomorrow...
- Prof
$SPY - It can get ugly unless...If AMEX:SPY fails to bounce from here and breaks below $522 - $520 area, things will get ugly real quick!
The members of the Fed are becoming sports commentators, narrating every move in the macro data and causing havoc in the market.
Potential downside targets:
$515
$498
$475

The Mechanics Of Trading - Part IIIPart III
I started this video because a friend asked me for help determining trends on multi-interval (time frames) and asked how I look at trading across multiple intervals. Asking how to best setup/use price trends to capture the best trade setups.
Essentially, it comes down to three key components...
A. Initial reversal/impulse waves should be traded lightly (if at all). They are the "potential price reversal setups" that are usually the most dangerous for traders (and often fairly short in length).
B. Looking for the second wave to form provides traders with the opportunity to catch the bigger Wave-3. This wave forms after the impulse (Wave-1) and a corrective wave (Wave-2), which must stay below any previous ultimate high or above any previous ultimate low.
C. Wave-3, and Wave-5 if applicable, are where traders can flex their muscles related to trade size using the techniques I present to try to capture the MEAT (Sweet Spot) of any trend.
Remember, after Wave-3, you must prepare for the potential end of a trend setup where volatility is likely to increase and risks become a bit more elevated.
I go over multiple techniques in this video.
Fibonacci techniques and Fibonacci Price Theory
Anchor Bars (breakaway bars)
Using Fibonacci Retracements to identify key support/resistance levels for trending
Stochastics
RSI
Wave formations (ZigZag)
and Others
This video is designed as an instructional video to help you incorporate usable techniques into your own trading style.
Hope you enjoy.

ICT Short setup SPY swing trade, retracement trade👋Hello Traders,
Our 🖥️ AI system detected that there is an H4 or higher timeframe ICT Short setup in SPY for Swing trade.
Of course SPY is in up trend in Daily chart, so this is a retracement trade for reference.
Or you could consider to buy SPY after reaching the demand zone marked on chart.
Please refer to the details Stop loss, FVG(Sell Zone),open for take profit.
For more ideas, you are welcome to visit our profile in tradingview.
Have a good day!
Please give this post a like if you like this kind of simple idea, your feedback will bring our signal to next better level, thanks for support!

SPY Summer PullbackThe recent low levels of liquidity may become more prevalent moving into the summer time as vacation time for many nears.
I am also waiting to hear the decision from the Bank Of Canada as well as other major banks around the world about the start of quantitative easing and lowering interest rates as soon as June.
The only problem with this, is the increasing value of the USD/DXY which may begin to strengthen against other currencies whom begin their devaluation.
Because the markets are generally measured relative to the dollar, a stronger DXY may provide the market with some downside in the summer months.
We do have some gaps (inefficiency) below at approx. 505-510 on the SPY. Interestingly or not , the golden 0.618 golden fib overlaps perfectly in these potential support zones.
I do not quite see the larger probability of a major market crash during an election year at the moment, and the longer term trend is still bullish.
Lets see how things play out

SPY bigger pictureI am going slowly short.
SPY should make another leg down this week.
Level of interest is 475-470
Lets see what Wednesday will bring, until then we should stay flat.
From the lows of 470, we shall do the usual election run.
target 548?
Ill be updating this idea.

Ichimoku Watch: SPDR S&P 500 ETF Trust Engaging with SupportDesigned to track the performance of the S&P 500 market index, the SPDR S&P 500 ETF Trust (current AUM is US$529,081.40 million) is engaging with an interesting area of support on the 4h chart after gapping lower on Wednesday. This follows an all-time high forged last week at $534.00.
SPDR Testing Support
The uptrend in this market at the moment is obvious, and traders, therefore, will be seeking locations for dip-buying opportunities.
The Ichimoku Cloud’s upper limit was tested yesterday, currently between $525 and $529 (the difference between the Leading Span A and Leading Span B), and could be enough to encourage buying. This is also the first time the Cloud has been tested since the Leading Span A crossed above the Leading Span B at the beginning of May.
Within the Cloud, there is also a 100% projection ratio at $522.00, which, for many harmonic traders, will be recognised as a potential AB=CD support level. Further to this, a trendline support (from the low of $493.86) is close to this level.
Adding to the above analysis, the Conversion Line appears poised to cross back above the Base Line, which, given the uptrend, would be observed as a bullish signal.
Price Direction Favouring Bulls
The trend in this market and the current support structure suggest that it remains a buyers’ market. Within the Ichimoku Cloud, the AB=CD support and trendline support could provide a floor to which dip-buyers may be drawn.
However, should the Conversion Line cross back above the Base Line prior to testing the above support area, we could see dip-buyers enter this market earlier to challenge all-time highs.

S&P stalls in indecision; still bullishLast week was marked with indecision. Market was moving in a narrow range while Buyers were waiting for FOMC ad NVDIA’s earnings. After receiving positive confirmation (FOMC neutral, earnings good) market tried to go higher but found no support from large players. Sellers took advantage of the weakness and dropped price, clearing many weak longs established in the previous 5 days. It was a strong move but for some reason sellers lacked conviction to go lower. Price pivoted after filling the gap from Wednesday 15th and went back into the balance zone ( 527.5-531.5 ).
We should expect more pushes and pulls in the short term while market is fishing for new information. To confirm their control buyers must clear last week high ( 533 ) and build value above it. Bears’ objective is to break last week low ( 525 ). Until it happens the most likely scenario is bracketing within last week range.
It is important to note that while short term direction is unclear, we are still in weekly uptrend. So bears must work twice hard to prove their strength
Disclaimer
I don't give trading or investing advice, just sharing my thoughts.

$SPY & CRE PanicIgnoring mainstream news and whatever and only using my data i'm seeing that CRE is experiencing unknown trouble. While SPY and other indices have been pumping possibly thanks to NVDA, CRE has been experiencing big trouble.
I think CRE trouble may spill over to the rest of the market as some kind of SVB/SIVB-like event sometime soon e.g June/July and will end at the start-mid August.
In my data below there's a big gap between SPY & CRE. When this gap first started forming, SPY did follow CRE data downwards but then got saved by... i dunno NVDA, the rest of the market... no idea. imgur.com
Point is the gap still exists and gaps are always fulfilled by being closed off one way or another.
"In a deep pub Clive British voice": I recon SPY goes down soon.
There's a chance we triple top on SPY before anything actually happens e.g we visit $523, then back up to $535, then after some consolidation finally break downwards to the $465's area. Actually hoping we this current double top resolves starting now and we do a quick visit to $465 before rebounding back upwards.
Thanks for attending this Ted talk.

$SPY May 30,2024AMEX:SPY May 30,2024
15 Minutes.
At the moment long only above 533.07 for any higher targets.
A The rise from 493 to 533
B The rise from 519.74 to 533.07
C the fall from 529.9 to 525.39
AT the moment these are the 3 important numbers.
At the moment I will consider B and C only.
For the rise B important to hold 524 levels being 61.8% retracement for the rise.
For the fall 529.9 to 525.39, a retracement to 528 levels will give an opportunity to short.
At the moment upside is limited to 532 533 levels
Since we have multiple touch points on 531-533 levels, I expect a swift move upside once 533.5 is crossed convincingly.
And on downside 524 is important to hold. If 524 is broken, then we can see at least 521-522 as target which is 21 ema in daily.
So, I will think only on short side today.


SPY turns bearish After pulling away from the upper Bollinger band earlier this week, the MACD has indicated that this Bullshit are about to be taken to the woodshed. Selling calls is easy money IMHO.

back to ATHs very possibleAMEX:SPY had an interesting wick
In my opinion all it did was rebalance, and took some stops i honetsly see it opening limit up on tuesday

$SPY May 29, 2024AMEX:SPY May 29, 2024
15 Minutes
The steep fall from 533.07 to 524.73 is getting sorted out. Sideways consolidation.
For the risefrom 524.73 to 530.5 AMEX:SPY has retraced nearly 61.8%.
Consider the last rise from 527.11 to 529.8 holding 528 levels i have a target 530 - 532 levels and on downside if 527 is broken possible target is 524-525 levels.
So being 2$ on both sides i prefer to sit out today also.

This is my personal planDrew a line for where I'm looking SPY to open tomorrow, hoping buyers swoop in and try for ATH, should be easy since all the big names are down but without catalyst for correction. Either way, looking towards second week of June if the medium time frame MA is to be followed.
Just hard to believe that Friday's inflation data will be positive -- but I'm thinking while inflation holds steady, household income will fall, and we'll see how markets react to that.
Otherwise, chop chop
