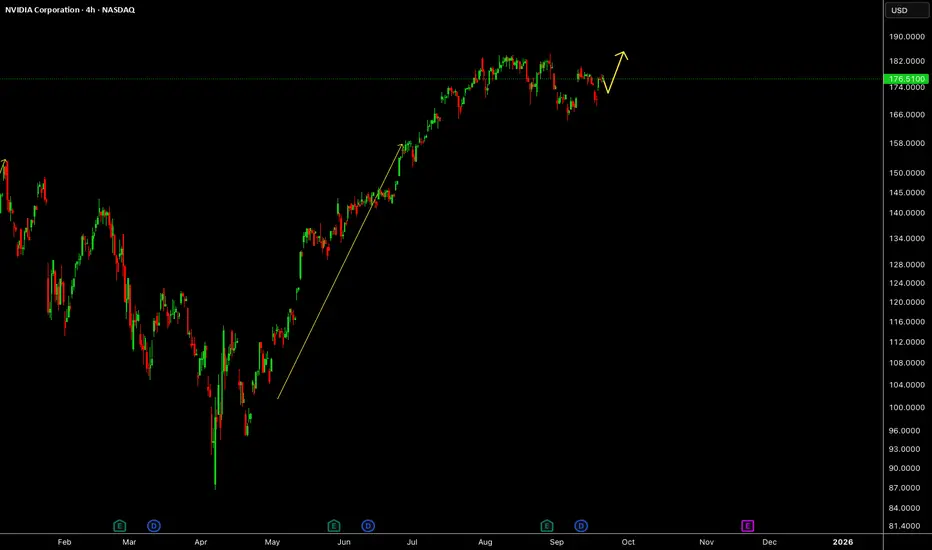
Nvidia - Starting a clear +20% rally!🧲Nvidia ( NASDAQ:NVDA ) rallies higher now:
🔎Analysis summary:
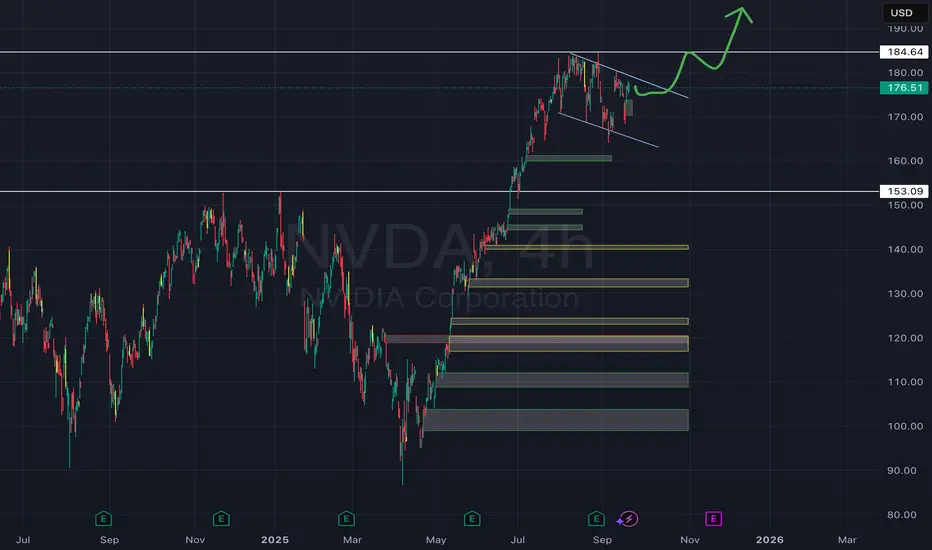
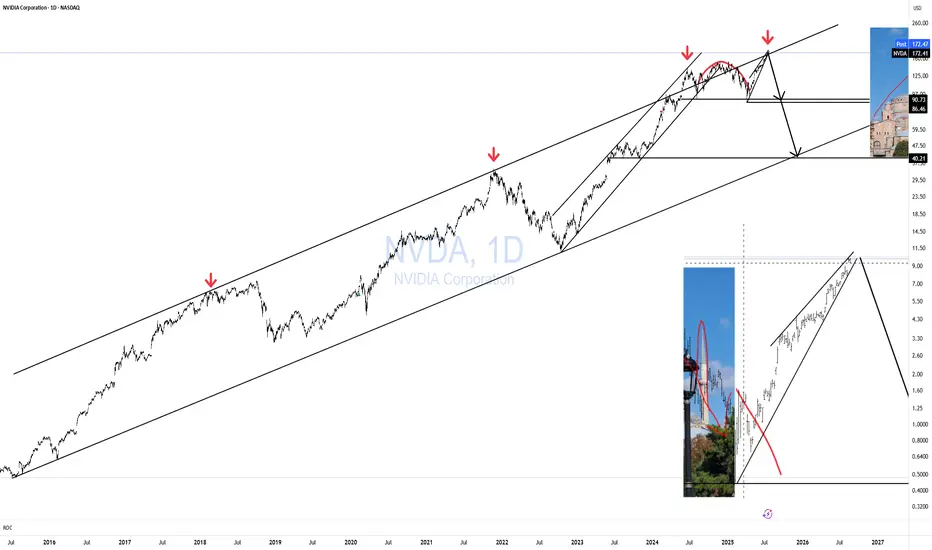
About one decade ago, Nvidia broke out of a major bullish triangle pattern. Following this remarkable breakout, Nvidia continued with a rally of about +35.000%. But looking at all these previous cycles, Nvidia remains bullish with another potential +20% move towards the upside.
📝Levels to watch:
$200, $250
SwingTraderPhil
SwingTrading.Simplified. | Investing.Simplified. | #LONGTERMVISION
0R1I trade ideas

Nvidia Returns to Yearly Highs on Temporary Boost in ConfidenceNvidia’s stock started the week with a gain of more than 4%, maintaining a steady bullish bias after it was announced that the company will invest over $100 billion in OpenAI to support the development of artificial intelligence infrastructure. As part of the agreement, Nvidia is expected to receive OpenAI shares as compensation. This move reflects both companies’ commitment to sustained growth in the AI industry and suggests that Nvidia views this project as a key step to strengthen its position beyond microchip production, seeking to consolidate itself as a strategic player in the sector over the long term. For now, market confidence has fueled buying pressure, and if further announcements are made, this trend could continue to dominate in the short term.
Short-Term Sideways Range at Risk
In recent weeks, Nvidia’s price had been moving within a sideways range, with a ceiling near $183 per share and a floor around $162. However, the latest bullish momentum is pushing the stock to test this resistance. If buying pressure holds, the range could break out and pave the way for a more relevant bullish bias in the coming sessions.
RSI
The RSI line remains above the neutral level of 50, showing that short-term bullish momentum has begun to dominate the average of the last 14 sessions. As long as this trend continues and the indicator does not enter overbought territory, buying pressure could become even more relevant in the short term.
MACD
The MACD histogram has started to show oscillations above the neutral 0 level, suggesting that the average strength of the moving averages has entered a steady bullish zone. If this signal persists, it could open the door to a stronger bullish bias in the short term.
Key Levels to Watch:
$183 – Yearly Resistance: Marks the yearly high and is the most important barrier in the short term. A sustained breakout above this level could drive the continuation of the broader bullish trend seen in recent weeks.
$173 – Nearby Barrier: Aligns with the zone marked by the Ichimoku cloud. Price action around this level could generate neutrality and extend the ongoing sideways formation.
$162 – Critical Support: Matches the 100-period moving average and the 23.6% Fibonacci retracement. A break below this support would activate a more relevant bearish bias, opening the door to a short-term downtrend.
Written by Julian Pineda, CFA – Market Analyst

$NVDA: Structural Extension🏛️ RESEARCH NOTES
Rejections at highs look way too systematic. I also see drop in average %𝜟 of both parties at local top of ongoing wave.
⚖️ That means we can extend this structure to cover the possible compression (otherwise the escape).

NVDA NVIDIA Corporation Options Ahead of EarningsIf you haven`t bought NVDA before the previous earnings:
Now analyzing the options chain and the chart patterns of NVDA NVIDIA Corporation prior to the earnings report this week,
I would consider purchasing the 150usd strike price Calls with
an expiration date of 2025-9-19,
for a premium of approximately $13.35.
If these options prove to be profitable prior to the earnings release, I would sell at least half of them.

NVDA Is Setup to Break New All-time Highs2025-09-26: NVDA Bullish Setup is Ready
1). Higher Lows Thursday ($173.13), Friday ($174.93). Will be perfect setup if next Monday close higher than $174.93.
2). Today vs Startup date Volume 23% Decrease 09-18: 191.76M vs 09-26 148.47M
3). Support Doji (Lower wig longer)
4). Close above all Moving Averages
NVDIANVDIA has one more push up to take all time high.
Disclosure: We are part of Trade Nation's Influencer program and receive a monthly fee for using their TradingView charts in our analysis.
NVDA: Potential Long Opportunity at Key Support LevelHello, fellow traders.
This analysis looks at a potential bullish setup on the 15-minute chart for NVIDIA (NVDA).
A key horizontal level has been identified around the $175.24 mark. As seen on the chart, this price has acted as a significant area of both support and resistance in recent trading sessions, indicating its importance to the market.
The price has recently pulled back to this level and appears to be holding, suggesting that it is currently acting as strong support. This bounce from a critical level could present a potential buying opportunity.
Here is a breakdown of the trade idea illustrated on the chart:
Entry: A long position is considered around the current price of $178.19.
Stop Loss: The stop loss is placed at approximately $172.22. This is set below the key support line and the recent swing lows, aiming to protect against a false breakout to the downside.
Take Profit: The target for this trade is set at $191.00, aiming for a significant move higher.
This setup offers a favorable risk-to-reward ratio. The trade thesis is valid as long as the price remains above the key support zone around $175.24. A firm break below this level would invalidate this bullish idea.
Disclaimer: This is a technical analysis idea for educational and discussion purposes only. It does not constitute financial or investment advice. Always conduct your own research and risk management before entering any trade.

$NVDA - $280 PT WEEKLY BULL FLAGStay Positioned with Nvidia's Weekly Bullish Chart. A Bull Flag is setting up with an imminent breakout. Long/Short Ratio is also very bullish at almost 60%. Price Target is $280. Remember Pole length of the flag = extended measured move at the breakout point of the flag.

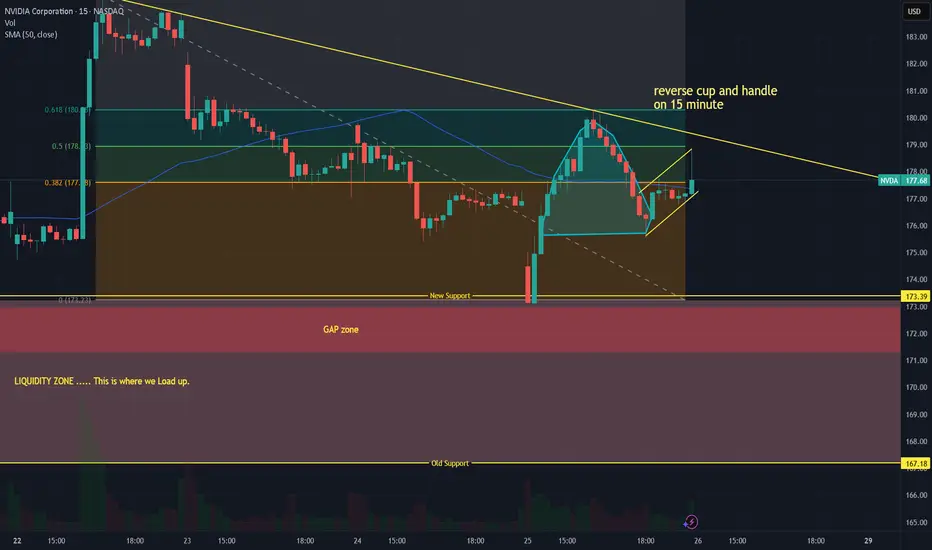
$NVDA Reverse cup and handle on 15 & 45 m...After a brutal day today in the Market. I am seeing a reverse cup and handle form on the 15- and 45-minute frames. There is huge Gap that has yet to be filled in the Liquidity zone at 172 & 171.
It would need to touch or break below $171 in order to close the Gap.
Personally, I would wait for that Gap to close and load up on Call options in Call Debit Spread for those who can't afford call premiums. THIS IS NOT FINANCIAL ADVICE.
I think if closes red tomorrow we could potentially see a Gap down next week Monday. Fib Retracement shows that it will duck down below. Potentially will see another red day tomorrow into next week.
AS ALWAYS THIS IS NOT FINANCIAL ADVICE, I AM A SELF-TAUGHT MARKET ANALYST THIS IS MY OPINION. GODBLESS YOU ALL, JESUS LOVES YOU.
Nvidia and OpenAI Announce Partnership, NVDA Shares SurgeNvidia and OpenAI Announce Partnership, NVDA Shares Surge
Yesterday it was revealed that leading chipmaker Nvidia and leading artificial intelligence research laboratory OpenAI have announced a strategic partnership, under which Nvidia will invest $100 billion in OpenAI.
A network of data centres will also be created to train and operate the most advanced artificial intelligence models:
→ the network will be based on Nvidia’s next-generation platform, Vera Rubin;
→ the network’s total capacity is unprecedented, reaching 10 gigawatts;
→ the first phase of the project is expected to launch in the second half of 2026.
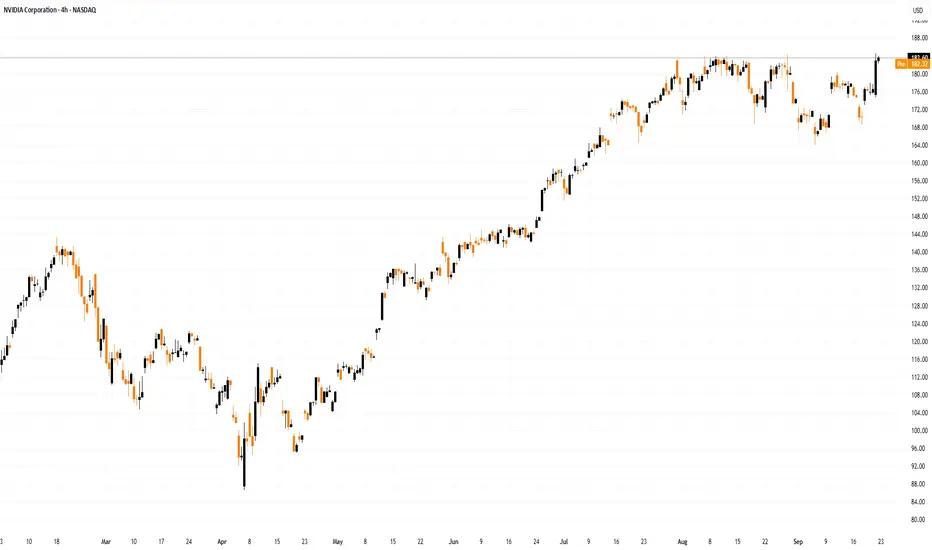
Nvidia (NVDA) shares reacted sharply to the news. During Monday’s trading, 22 September, the company’s stock price jumped by roughly 4%, climbing at yesterday’s high above $184.30 (marking a new all-time record, as shown on the chart). The chipmaker’s market capitalisation closed in on $4.5 trillion, cementing its status as the most valuable company in the world.
Technical Analysis of Nvidia (NVDA) Chart
Previously, in our 1 September analysis of NVDA, we:
→ plotted an ascending channel describing NVDA’s price movements following the bullish impulse at the end of June;
→ noted unsuccessful attempts by the bulls to break resistance at $183, which provided grounds to view the chart in the context of a Triple Top pattern (1-2-3);
→ assumed that the bears were exerting pressure on an overvalued stock and considered a correction scenario.
Since then, the Nvidia stock price corrected to $165, from where it resumed its upward trend (shown with a broken arrow).
The new data provide grounds to:
→ expand the channel (shown in blue) without changing its slope, adding the QH and QL lines to divide the wider channel into quarters;
→ plot the trajectory of the correction (in red).
Within this context, it is reasonable to assume that:
→ the stock price of NVDA found support at the QL line and moved up towards the midline;
→ the red lines form a Bullish Flag pattern;
→ yesterday’s rise broke out of this corrective pattern, with the bulls attempting to resume the upward trend, though the $183 level still provides resistance.
It is not excluded that the strong fundamental background, the development of AI technologies, and the supportive driver of the Fed’s rate cut may ultimately enable the bulls to overcome the $183 level, paving the way for NVDA’s share price to approach the psychological $200 mark.
This article represents the opinion of the Companies operating under the FXOpen brand only. It is not to be construed as an offer, solicitation, or recommendation with respect to products and services provided by the Companies operating under the FXOpen brand, nor is it to be considered financial advice.
H&S on NVDA pullback immenentShort post:
Drawdown to 124$ levels is most likely and probably happens by end of Oct.

Higher 4 longer.Bull flag here on the longer time framez should play out. Maybe chop sidewayz then push back to ATH. AI nerrative still strong n no reason 2 go heavy shortin this scam. If u short u better take ur money on those small downturnz cause trust me, they dont last!
NVDA HAGIA SOPHIA!The Hagia Sophia pattern has now fully formed; it just needs the crack! and the Hook!
No matter what your vague hunches and feelings are about AI, the charts will always win.
You can't "buy the dip" unless you know when to "Sell the Rip"!
If you can't see this resistance area, I don't know what to tell you.
Everyone is bullish at the top of a bubbliotious market without exception!
Click boost, Like, Subscribe! Let's get to 5,000 followers. ))
NVDA eyes on $183.72: Golden Genesis fib about to BREAK and RUN?NVDA has been struggling against this Golden Genesis for months.
Latest news gave a surge that should BREAK and start next leg up.
Looking for a Break-n-Retest of $183.72 for next long entries.
.
See "Related Publications" for previous charts, such as this BOTTOM CALL:
Hit BOOST and FOLLOW for more such PRECISE and TIMELY charts.
=========================================================
.

Bullish Momentum Builds as Nvidia Exits Consolidation Phase🚀 Nvidia Nears Breakout: Strong uptrend with volume profile support. Consolidation phase close to completion. Entry $172.95 | SL $167 | TP $255.65 → Attractive risk/reward setup for continuation higher. Let the bulls do their work — update to follow.
⚠️ Not financial advice.
NVDA buy order
Price sold off at 178.04 the broke out showing that price is bullish the next time price is above 178.04
We see bullish structure (higher highs higher lows)
We see the textbook price action
Indication
Correction
Continuation
Good RR (1:3)
We also have Nvidia wanting to invest $100B into Chatgpt (Bit of fundamentals for ya)

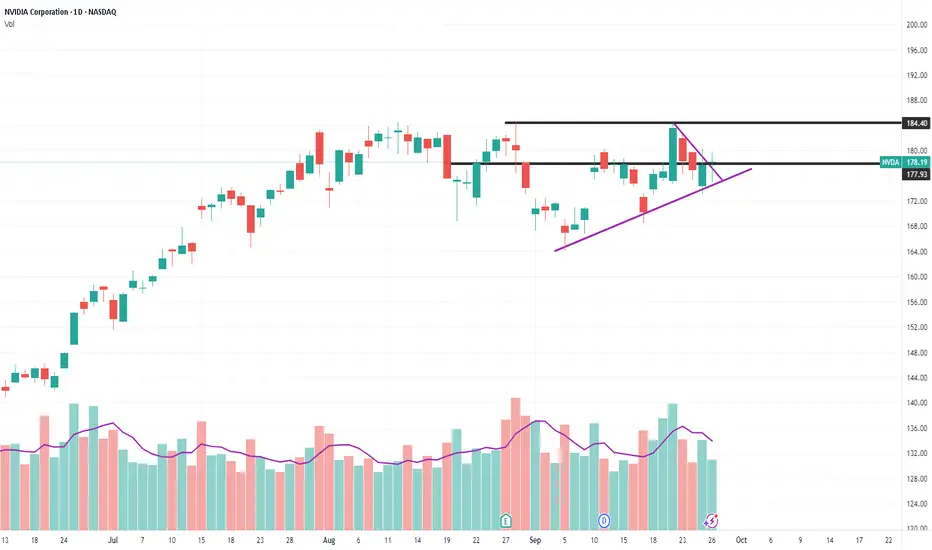
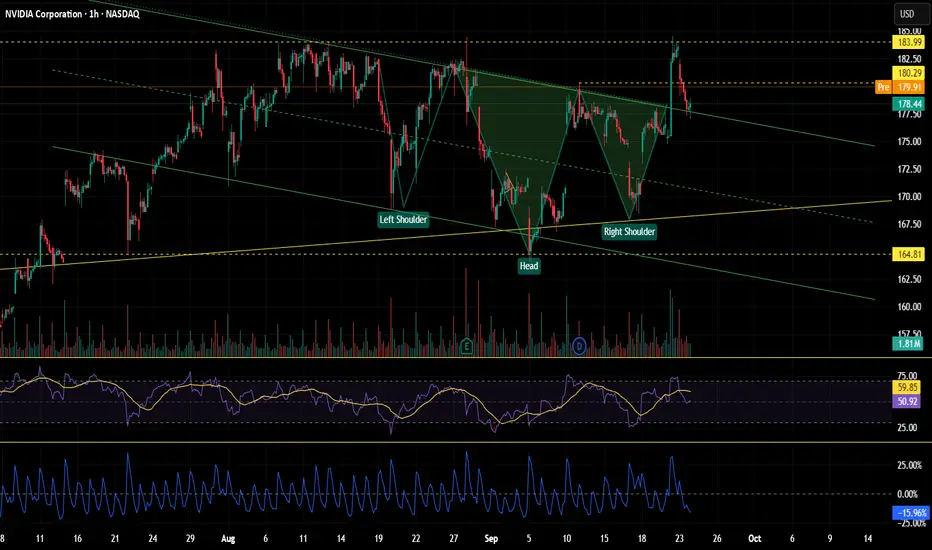
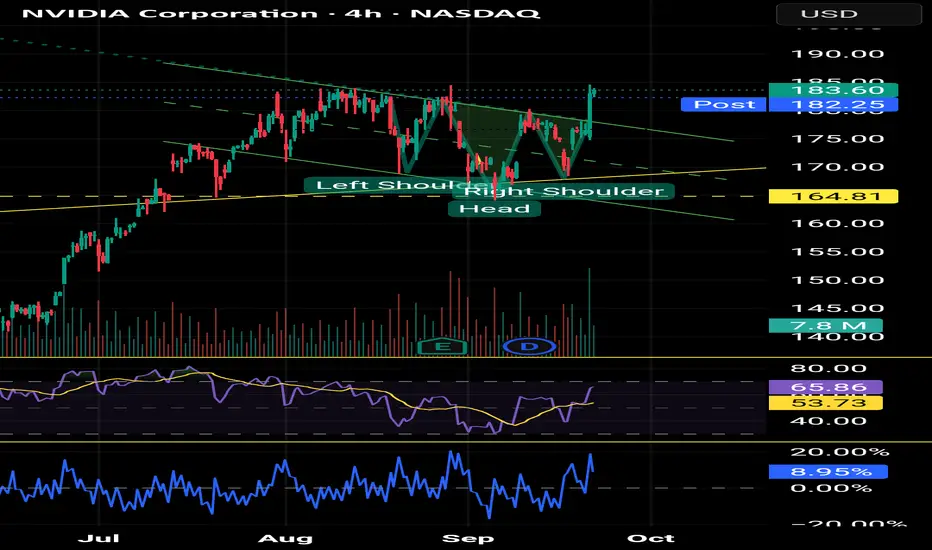
bull flag and inverse head and shoulder breakout retestOn monday 22sept we broke the bullflag/ descending channel and also inverse head and shoulders on the 4hour chart with high volume.
Yesterday we went for a retest of the breakout as expected to 177.6
the 4hours candle closed as a bullish hammer candle.
Todays expectation is nvidia to retest or break its ATH at 184.
If we break 184 today we are lookig at the target of the inverse head and shoulder by end of week wich is 195.
if you look at the rsi ,the rsi is not overbought anymore and made a higher high so no signs of the bears.
$200 PTStrong move with Open AI investment announcement. Barely made a new 52 week high, looking for a strong continuation tomorrow; $200 price target as next milestone in price discovery.

NVIDIA’s Decisive Battle at the $185 Resistance🔹 Short-Term Outlook (1–3 Weeks)
Current Situation:
NVIDIA (NVDA) is trading around $183.6, right below the critical $185 resistance—a level that has repeatedly capped the stock’s rallies.
Momentum & Pattern:
The price has reclaimed the 50-day moving average ($175.9) with a strong bullish candle, signaling renewed buying interest.
Bullish Scenario:
If NVDA breaks and holds above $185:
🎯 Target 1: $195
🎯 Target 2: $205
Bearish Scenario:
If the stock fails to break $185 and closes below $175:
❌ Short-Term Stop Loss: below $175
🎯 Downside Target: $165
🔹 Long-Term Outlook (2–6 Months)
Overall Trend:
The medium-term trend remains bullish, and a decisive breakout above $185 could ignite a new rally.
Bullish Scenario:
🎯 Medium-Term Target: $220
🎯 Long-Term Target: $250
Bearish Scenario:
If the stock loses the $160 support:
❌ Long-Term Stop Loss: below $160
🎯 Downside Target: $140
✅ Summary:
NVDA stands at a pivotal level. A breakout above $185 could open the door to $200 and higher, while rejection at this level risks a pullback toward $165.

Nvidia ATH breakoutNvidia is set to break out its ATH again.
Nvidia has formed a inverse head and shoulder inside a bull flag. Both has broken out today after the 100b open ai announcement. This weeks price target is 195. And alot more highs will come thos year.
NVIDIA NVIDIA Corporation is a leading American technology company headquartered in Santa Clara, California, renowned for designing and manufacturing graphics processing units (GPUs) that power gaming, professional visualization, and artificial intelligence (AI) applications. Founded in 1993, NVIDIA revolutionized the graphics industry with its GeForce series of consumer GPUs and expanded into AI computing, becoming a key supplier of AI chips globally.
Key Aspects of NVIDIA in 2025:
Dominates the discrete GPU market with approximately 92% market share.
Powers more than 75% of the world’s fastest supercomputers, particularly in AI and machine learning workloads.
Achieved a historic market capitalization exceeding $4 trillion in mid-2025.
Continues to release advanced AI models and platforms, leveraging its GPU technology for sectors like autonomous vehicles, data centers, and cloud computing.
Has a strategic partnership with Intel to jointly develop AI infrastructure and integrated CPU-GPU platforms.
Strong innovation focus on AI edge computing, high-performance computing (HPC), and neural network acceleration.
NVIDIA remains a central force in the global semiconductor ecosystem, driving advancements in AI, gaming, and professional graphics.
#AI #STOCKS #NVIDIA

NVDA Setup Explained: Layered Entry + Clear SL/TP Levels😎 NVDA Thief’s Wealth Heist: Swing/Day Trade Blueprint 🚀
Asset: NVIDIA Corporation (NVDA) 📈Vibe: Bullish, sneaky, and ready to snatch profits with style! 💰
Welcome, ladies and gentlemen, to the Thief’s OG Wealth Strategy Map for NVDA!
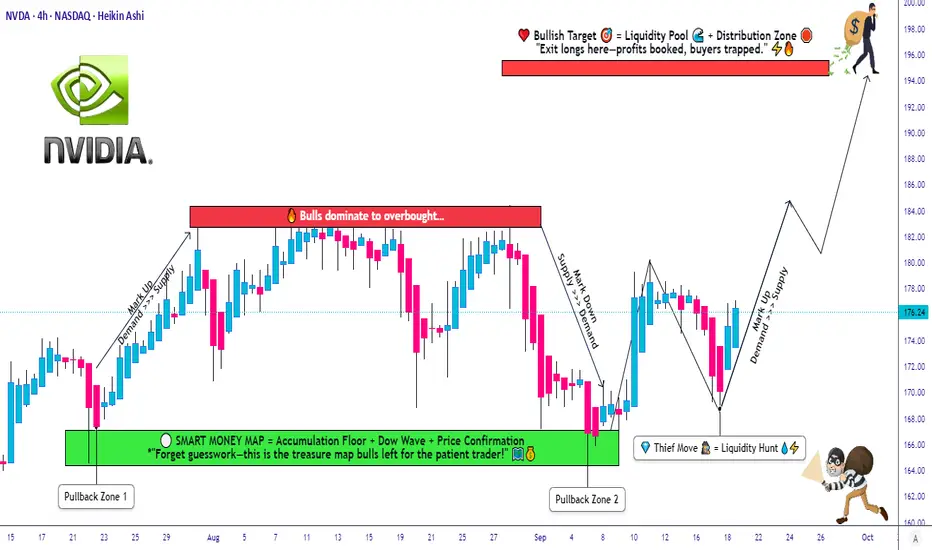
This is a fun swing/day trading plan designed to grab liquidity like a master thief. Let’s break down this bullish setup with a double bottom pullback, layered entries, and a cheeky escape plan. Ready to outsmart the market? 🕵️♂️
📊 Market Analysis: Why NVDA?
NVDA is riding a bullish wave 🌊, confirmed by a double bottom pullback pattern and a sneaky liquidity grab at key support levels. The stock’s momentum is screaming “UP!” as buyers step in to defend the price. This setup is perfect for swing or day traders looking to capitalize on NVIDIA’s tech-fueled surge. 💻
🗺️ The Thief’s Plan: Bullish Heist Strategy
🎯 Entry Strategy:Deploy the Thief’s Layering Tactic with multiple buy limit orders to maximize your entry precision.
Suggested price levels:
$172.00
$174.00
$176.00
$178.00
Pro Tip: Feel free to add more layers based on your risk appetite and market conditions. The more, the merrier! 🧑💼
🛑 Stop Loss (SL):Set a Thief’s SL at $168.00 to protect your loot.
Note: Dear Thief OGs, this SL is my suggestion, but you’re the boss of your trades! Adjust based on your risk tolerance and let the profits roll. 💸
🎉 Take Profit (TP):Aim for the juicy $195.00 target, where we expect strong resistance, potential overbought conditions, and a possible trap for the unprepared. Lock in those hard-earned gains and escape like a pro! 🏃♂️
Note: This TP is my call, but you do you! Take profits at your own pace and keep the cash flowin’. 😎
🔗 Related Pairs to Watch (in USD)
To boost your market awareness, keep an eye on these correlated assets:
NASDAQ:AMD (Advanced Micro Devices): NVDA’s chipmaking cousin often moves in tandem. A bullish NVDA could signal strength in AMD. 📡
NASDAQ:SMH (VanEck Semiconductor ETF): This ETF tracks the semiconductor sector, including NVDA. Watch for sector-wide momentum. 📊
NASDAQ:QQQ (Invesco QQQ Trust): NVDA’s a heavy hitter in this tech-heavy ETF. QQQ’s trend can confirm NVDA’s direction. 🚀
Key Correlation Point: NVDA’s performance is tied to the broader semiconductor and tech sector. If AMD or SMH shows bullish patterns, it reinforces NVDA’s upside potential. Conversely, weakness in QQQ could signal caution. Stay sharp, thieves! 🕵️
🛠️ Why This Setup Rocks
Double Bottom Pullback: A textbook bullish reversal pattern, signaling strong buying interest. 📉➡️📈
Liquidity Grab: The market’s attempt to shake out weak hands before the real move up. We’re smarter than that! 😏
Layered Entries: Spread your risk across multiple price levels for a smoother ride. 🎢
Risk Management: Clear SL and TP levels keep your heist disciplined and profitable. 🧠
⚠️ Disclaimer
This Thief Style Trading Strategy is just for fun and educational purposes! I’m not a financial advisor, and trading involves risks. Make your own decisions, manage your risk, and trade responsibly. Let’s keep the vibes high and the losses low! 😜
✨ “If you find value in my analysis, a 👍 and 🚀 boost is much appreciated — it helps me share more setups with the community!”
#NVIDIA #NVDA #Trading #SwingTrading #DayTrading #ThiefStrategy #StockMarket #Bullish #TechnicalAnalysis
NVIDIA Corporation (NVDA) Expands AI Chip LeadershipNVIDIA Corporation (NVDA) is a global leader in graphics processing units (GPUs) and AI computing platforms. Best known for powering gaming, data centers, and professional visualization, NVIDIA also drives innovation in autonomous vehicles, healthcare, and supercomputing. The company’s growth is fueled by explosive demand for AI chips, the rise of cloud computing, and its ability to expand GPU technology into nearly every corner of the digital economy.
On the chart, a confirmation bar with rising volume highlights bullish momentum. The price has entered the momentum zone after climbing above the .236 Fibonacci level. A trailing stop can be placed just below this Fibonacci line using the Fibonacci snap tool, helping traders lock in profits while staying positioned for more potential upside.
