Targeting $902 in (b)We tagged my long held target yesterday of $834, and now I'm of the opinion we get a corrective retrace targeting $902 before seeing lower.
Best to all,
Chris
0R1I trade ideas

NVIDIA (NVDA): Why $1,077 Could Be Just the Beginning!NVIDIA (NVDA): NASDAQ:NVDA
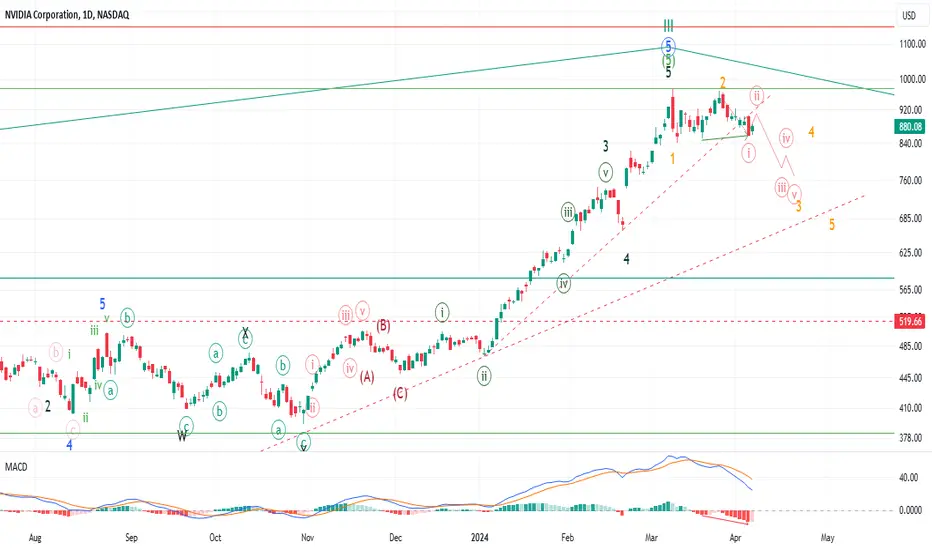
In our last analysis of NVIDIA, we presented an alternative scenario. However, given NVIDIA's relentless momentum, we find ourselves needing to adjust this scenario once more. We are now inclined to believe that we are still within a subordinate Wave 3 of the overarching Wave (3), anticipating that the price must reach at least the $1,030 mark, particularly considering the subordinate Wave ((iii)) precisely hit the 461.8% level.
Following a rapid sell-off to Wave (a), we've observed the formation of Wave (b) with a three-wave structure right at the 100% mark. This leads us to position an entry for Wave (c) or Wave ((iv)), as we theoretically should achieve the 100% mark here too, aligning with the minimum 23.6% level for a Wave 4 around the 100% mark, thus establishing our entry point.
Moreover, the gap present, along with the underlying support zone, could be crucial. Hence, we're setting our stop-loss just below this zone. For the upward movement, we anticipate that the subordinate Wave ((v)) of Wave 3 could reach at least up to $1,077, fitting within our minimum target range for Wave 3 and aligning well with our expectations. Should the price drop below this level, other zones could potentially accommodate a Wave ((iv)), but such a scenario would not be as rule-compliant, making this current scenario more likely than others.
Considering NVIDIA's recent performance, this setup presents a favorable risk-to-reward ratio for a short-term trade.
R:R - 6.3
Risk: max. 1%

Nvidia Enters Correction Zone After Plummeting by 10%Chipmaking giant Nvidia ( NASDAQ:NVDA ) finds itself navigating the stormy seas of correction territory. With shares down 10% from their recent all-time highs, investors are left wondering: what lies ahead for this AI powerhouse?
Nvidia's ascent to prominence has been nothing short of remarkable, fueled by the insatiable demand for its graphics processing units (GPUs) in the era of artificial intelligence. From powering compute-intensive AI applications to serving as the backbone of data centers, Nvidia's chips have been instrumental in driving the AI revolution forward.
However, as the dust settles and the euphoria of past gains fades, investors are left pondering the reasons behind Nvidia's recent downturn. One catalyst could be the unveiling of Intel's new AI chip, Gaudi 3, which promises to rival Nvidia's most advanced offerings. Boasting superior power efficiency and faster AI model processing capabilities, Intel's chip represents a formidable challenge to Nvidia's dominance in the AI space.
Moreover, analysts at D.A. Davidson have raised concerns about a potential cyclical downturn on the horizon for Nvidia. They point to factors such as the shrinking size of AI models and increased competition from alternative solutions, which could dampen demand for Nvidia's stock in the coming years.
Despite these headwinds, Nvidia ( NASDAQ:NVDA ) remains a titan in the world of AI technology, with a track record of delivering stellar financial performance. The company's recent earnings report showcased a staggering 486% jump in non-GAAP earnings per diluted share, underscoring the continued strength of its business.
As investors grapple with the uncertainty of market corrections and the evolving landscape of AI technology, Nvidia stands at a crossroads. Will it weather the storm and emerge stronger than ever, or will it succumb to the pressures of increased competition and shifting market dynamics? Only time will tell.
In the meantime, investors would be wise to keep a close eye on Nvidia's strategic moves and technological advancements, as they may hold the key to its future success in an ever-changing landscape.
Technical Outlook
Nvidia ( NASDAQ:NVDA ) stock is in a downward Trend with the stock closing at 2% loss in Tuesday's trading session. With a weak Relative Strength Index (RSI) of 44.99 paving way for further decline. Nvidia's ( NASDAQ:NVDA ) 4-month price chart shows a three-black bearish crow candlestick pattern further attesting to the bearish trend of this thesis.
In conclusion, while Nvidia ( NASDAQ:NVDA ) may be facing challenges in the present moment, its long-term prospects remain promising. As it adapts to the evolving demands of the AI market and navigates the complexities of correction territory, Nvidia has the potential to emerge as a resilient and enduring force in the world of technology.

NVIDIA CALLThe price drop slowed down on a daily demand zone and we can expect a new rally from the current area to $814, $840 and $890 price points.

NVDA CONTINUED DOWN TREND as long as we hold this zone, nvda is continuing lower from this exact zone.


NVDA LONG if nvda wants to continue lower from here, i have drawn out the zone it must hold if it wants to keep the trend of this degree intact, reaching targets of 1,000+. However, if we do not hold this NVDA is most likely in trouble with prices having a potential to retrace back to $400-$300 area, and if we can hold from there we can see targets of $1500+
Please note this is a weekly chart, and this can and will take years to unfold.

NVDA breaks below support lineNVDA today broke below its support line after breaking its long term upward trend on April 4th.
Broke upward trend and held breakdown earlier this week.
Broke below support today on strong volume indicating confirmation of movement.
Started to recover on weak volume indicating disagreement on movement.
I am expecting NVDA to come back up to support, test it and fail continuing its decline.
Action item: closed my long position and opening an option put.

NVIDIA 15 more percent before the earningsTrend still strong when breakout of the wedge could start a rally of 15% before earnings

Baby Abandoned... but...The candlestick formation that has been build past week looks like an Abandoned Baby. However the higher opening today has been sold immediately. This means tome that the market is not convinced of rising prices.
As well the Baby is not convincing as it does not stand at the end of a real downtrend. In my opinion the decline from the last March week till now is to short to consider this candlestick pattern as valid.
That's why I rather see it as a false one and so vice versa as a coming attempt to test the downside of the trading range since March once again.

$NVDA The Reversal is InIf this weekly candle closes as outside Bearish, the NVDA Reversal is Confirmed. Typically NVDA reverses when it gets between 36 and 38% away from the 27 Moving Average. As you can see here we topped at that level perfectly. 2hr and 4hr CCI has broken with the daily close behind. Major short targets lay at our 2 gaps which close at 822 and 675 respectively on the daily.
Hold on to your butts.


NVDA: Week of AprilHappy Easter for those who celebrate and happy spring (though that was a while ago, but still snow on and off here in Canada :( )
NVDA has been really tired lately. The setup for Monday is the infamous gap and crap.
From there we just need to see it hold the threshold and this wedge line its been straddling for weeks now and we can expect a grindy chop up.
Else if it breaaks down from this wedge, it will still go up. Its broken down so many times only to get bought back up.
That said, the weekly low targets are a real possibility with some large TF HA structures that support the move to these levels. Its just really hard to short when the S&P and NAZZZY Poo are just constantly breaking ATHs. They're essentially strong-arming NVDA (and many other stocks) and preventing it from actually tanking (you can tell NVDA is tired. The buying is not like it used to be). So we'll see.
Otherwise, those my thoughts. For me, looking at shorts into Monday and longs the remainder of the week if the wedge is respected!
Daily perspective of the wedge:
Safe trades!

NVIDIA Corporation (NVDA) - Technical AnalysisNVIDIA Corporation's stock (NASDAQ: NVDA) exhibits a confluence of technical indicators suggesting a bearish sentiment in the near term. The technical analysis covers a range of oscillators and trend-following indicators alongside volume and momentum-based measures to forecast potential price trajectories.
Price Action & Volume:
NVDA's recent price action has seen a retreat from its all-time high of 997.27, now consolidating around the 858.20 level. The trading volume of 7.945M, while slightly elevated, does not indicate a significant departure from the average volume over 30 days (52.90M), potentially signaling a lack of conviction in the current downtrend.
Ichimoku Cloud:
The Ichimoku Cloud analysis reveals that the price has dipped below the Base Line (Kijun-Sen) at 893.95, which could act as a resistance level in the near term. Furthermore, the Conversion Line (Tenkan-Sen) at 904.09 is trending downwards, showing that the short-term momentum is bearish. The cloud spans suggest potential support in the region of 789.87, which could stabilize the downtrend.
Moving Averages:
The price is currently trading below the 9-day EMA, indicating short-term bearishness. The 50-day and 200-day moving averages suggest a bullish configuration; however, the price below these levels signifies a weakening trend.
RSI & Stochastics:
The Relative Strength Index (RSI) at 48.33 suggests that NVDA is neither overbought nor oversold, although it leans toward the lower end of the neutral range. The Stochastic Oscillator indicates a slight momentum rebound with a crossover at an oversold region, potentially flagging a short-term price recovery or consolidation.
MACD:
The Moving Average Convergence Divergence (MACD) histogram shows declining bullish momentum as evidenced by shorter bars and a MACD line that is descending below the signal line. This indicates that the bullish trend is losing strength and could possibly reverse.
On-Balance Volume (OBV):
The OBV indicator at 15.924B shows that the selling pressure has been increasing, which could be indicative of a continued downtrend if the volume doesn't shift to show increased buying interest.
Speculative Price Targets:
Given the confluence of bearish indicators, if the downtrend continues, NVDA could test the next support level at the lower bound of the Ichimoku cloud, around 789.87. On the flip side, any reversal with substantial volume could see NVDA challenging the resistance near the Base Line of the Ichimoku Cloud at approximately 893.95. A decisive break above this level could invalidate the bearish outlook and target the psychological level of 900, followed by the 50-day moving average as the next resistance zone.
Conclusion:
NVDA's current technical posture leans toward a bearish outlook in the short term. Traders should watch for a potential bounce off the Ichimoku Cloud's support or a reversal with significant volume to signal a change in trend. Caution is warranted as the mixed signals from volume and momentum indicators suggest a possible consolidation phase before the next significant move. Investors should remain vigilant for any breaking news or fundamental changes that could influence market sentiment and catalyze a shift in the price trajectory of NVDA.

Come to Daddy NvidiaI have long been warning that Nvidia was on a path to tag $834 for a while now, Followers of mine can search previous posts. I received a ton of criticism about my analysis...even ridicule at times.
...and here we are on the verge.
My only question is do we get deeper into the target box?
Best to all,
Chris

Navigating Nvidia's VWAP Dynamics: A Trader's GuideNvidia (NVDA)
Having surged higher during the first quarter of the year, Nvidia’s share price is currently in ‘mean reversion mode’.
When it comes to measuring mean reversion, we can use traditional simple or exponential moving averages. We can see from Nvidia’s daily candle chart (below) that price has not yet reached the 50-day moving average which continues to slope upwards despite the recent sideways consolidation.
However, a perhaps more insightful measure of mean reversion is to use volume weighted average price (VWAP) anchored to key inflection points. If we anchor a VWAP to the recent trend highs and anchor another VWAP to the lows of the last trend leg (21st Feb lows), a compelling picture emerges: Nvidia's share price is effectively 'funnelled' between these two VWAPs.
This compression of price is also reflected in the swing highs and lows of the consolidation phase, forming a wedge pattern or flag formation.
NVDA Daily Candle Chart
Past performance is not a reliable indicator of future results
Trading Strategies:
In navigating Nvidia's VWAP dynamics, traders have several short-term strategies at their disposal:
1. Buying Breakout: A breakout and subsequent close above the VWAP funnel, accompanied by robust volume, could signify the continuation of Nvidia's upward trend.
2. Buying Support: Given Nvidia's established long-term uptrend, buying at support levels presents attractive risk/reward opportunities. Look for reversal candle patterns like bullish hammer or engulfing candles as triggers for buying support.
3. Shorting Breakdown: Conversely, a breakdown and close below the VWAP funnel might indicate the onset of a deeper retracement toward the 50-day moving average.
Risk Management:
Traders can employ Nvidia's Average True Range (ATR), currently at $35, as a baseline expectation for daily price movement. This should inform decisions regarding stop placement and price targets.
Nvidia is scheduled to release its Q1 2025 earnings on Wednesday, May 22nd, 2024.
Disclaimer: This is for information and learning purposes only. The information provided does not constitute investment advice nor take into account the individual financial circumstances or objectives of any investor. Any information that may be provided relating to past performance is not a reliable indicator of future results or performance. Social media channels are not relevant for UK residents.
Spread bets and CFDs are complex instruments and come with a high risk of losing money rapidly due to leverage. 84.01% of retail investor accounts lose money when trading spread bets and CFDs with this provider. You should consider whether you understand how spread bets and CFDs work and whether you can afford to take the high risk of losing your money.

BearishDouble top with both Bearish engulfing candles. Neckline break with Bearish engulfing candle... few consolidation and free fall is predicted.....


VOLUME HOLLOW CANDLES - A REQUESTTrading View recently added Volume Candles as an Option.
Volume candles provide very useful information in a very clear format.
I currently use Hollow Candles because they convey additional information over traditional candles and bar charts, specifically,
Hollow Candle color is determined by inter-day/period price movements, and intra-day price movements are depicted either Solid or Hollow.
Traditional Candle color is determined by intra-day/period price movement, and there is no indication of inter-day movement.
I would like to request that Trading View implement Volume Hollow Candles implemented.
I am hopeful that the additional code that was necessary to implement Volume Candles could be added to Hollow Candles to provide Hollow Volume Candles.
Even if it was relatively easy to do, it probably wouldn't happen unless there is significant member demand.
The primary purpose of this post is to garner member support for VHC.
I suspect that some members may not be aware of the advantages of Hollow Candles over Standard Candles. It took me a fair amount of effort to understand the difference, i.e., it wasn't obvious.
As part of this call to arms, I have documented my understanding of the differences, and I would recommend having a closer look at Hollow Candles if you not already done so.

Fork in the road for NVDAThere are two ways we can go from here in my opinion.
866 is a point of support for us, if that gets broken we will absolutely test the 855 range. If that gets broken, 841-839 is our next stop.
However I think if we close above the 866 support, we may see a climb to the upside to test resistance at 876, if that gets broken we may see 888 or 890 being tested.

Short NVIDIA. Bear 🐻 flag forming. Bear 🐻 flag forming. Chances in favour of more breakdown. Downward price targets pointed out in descending order. If $840 is lost next 🎯 are $758 and $692

NVDA | NVIDIA Corporation | AI and such | 2 Buy zonesCurrently looking to buy Nvidia on both buy zones if price should reach them.
Buy zone 1:
- Confluence with the former ATH und Swing High of the previous move (blue line)
- Partial gap fill (maybe fast move down to even fill the gap fully)
- Close on top of the 50% of the current swing
Buy zone 2:
- Range that created the sharp movement up including the gap
- Gap would be filled fully
- Below 50% of the current swing
Stop- Loss: None (Longterm play)
Target: Slightly below big the High of the current swin
Good luck
Disclaimer:
- This information does not constitute as financial advice and is only for educational purposes. I am not your financial advisor.
- You trade entirely at your own risk
- Make your own research
- Finance and trading is evil, capitalism is bad, duh ;)

NVDA:is the top in or $1000 nextNVDA go a little bounce on Friday from a little hidden bullish divergence in the MACD histogram. It also put in an inside bar, so, not a very good look at the moment. Right now, last Thursday's high and low will be the range to break. If this week price can break above $906, then the chance for making $1000 increases. Perhaps, that is what the company is looking for to maximize the stock split, or perhaps the market wants the magic number to unload.
If $857 break down, then the EW count gets momentum. But to confirm that the downtrend has started or not, we need a full 5 wave sequence completed. Along with a breach of the long term trendline, it will be sell every bounce for NVDA for the foreseeable future. Cycle degree wave 4 can last for a few years.
NVDA is going to be a bit difficult to trade in the short term, so, keeping an open mind and fast fingers will be crucial.