0R1I trade ideas

$nvda update #Nvidia #NVDA update:
#Wallstreet back online after holidays with a familiar trend.
As major chipmaker stocks significantly outperformed the broader market.
Nvda stocks surged over 6% ->1.128, reaching New ATH.
( #ElonMusk xAI plans to build supercomputer fuel by #nvidea chips )
NVIDIA keeps on producing incredible results. We got ourselves another gap up to the next PPoint(1D). At this point we have adjust frames to continue analysis of the price movement but don't be surprised to see R5 touched, if R4 holds. Would like to see a double b bounce as with previous point for further confirmation.

looking for a short-term top in $NVDANVIDIA incorporates a platform strategy to grow in the Gaming, Professional Visualization, Datacenter, and Automotive markets. It is crucial to provide a complete computing solution and not just a chipset or software for its target markets. By focusing on the platform strategy, the company can seamlessly provide interconnected solutions that meet customer’s end-to-end needs.

$NVDA Jack in BoxSimple project where all lines from all rectangles are projected potential support and resistance. Looking to catch at least one reversal (in either direction) with a candlestick pattern or signal at any of them.
The vertical ones are more like time stamps for potential essential events like change in mood, sentiment, volatility or other.
The polygon is more like a zone where the probability of being penetrated is much lower than in other areas of the chart. This zone can provide a reversal too if it is accurate.
I will also be looking for potential consolidations inside the bigger rectangles which can lead to a breakout scenario from them, but I might be wrong on this envisioned scenario. Time will tell.
Will also try to cover with comments any relevant interesting Candlestick setups that catch my attention or interest.

I see the futureRemember this when you think something is unbeatable
Someone will cash his profits, a correction will happen at one point or another.

Nvidia Stock Surges Above $1,000 up by 5%Nvidia ( NASDAQ:NVDA ) has surged above the 1,000 level for the first time in a year, with its market cap racing past $2.5 trillion. The chip giant's earnings and sales growth have led it to pass or challenge Apple ( NASDAQ:AAPL ) and Microsoft ( NASDAQ:MSFT ) as the world's most valuable company. Nvidia ( NASDAQ:NVDA ) stock surged 15.1% last week to a record 1,064.19, blasting past 1,000. The chip giant increased its market cap by $338 billion to $2.661 trillion as of May 24, just behind Apple ($2.913 trillion) and not far from Microsoft ($3.196 trillion).
At the end of last year, Nvidia ( NASDAQ:NVDA ) had a $1.22 trillion market cap, lagging Google parent Alphabet ( NASDAQ:GOOGL ) and Amazon.com ( NASDAQ:AMZN ) in addition to Apple and Microsoft. Out of the Magnificent Seven stocks, Nvidia only had a higher valuation than Meta Platforms (META) and Tesla ( NASDAQ:TSLA ).
On May 22, Nvidia ( NASDAQ:NVDA ) reported Q1 2025 earnings per share of $6.12, up 461% vs. a year earlier, with revenue soaring 265% to $26.04 billion. Analysts expect Nvidia earnings to soar 107% in fiscal 2025 to $26.85 a share, followed by a 31% gain in fiscal 2026 to $35.12.
Microsoft, Apple, and the other Magnificent Seven stocks have various catalysts, but a lot of that reflects AI growth, or at least AI growth hopes that are good news for Nvidia. Megacap techs are spending massively on AI, with a lot of that going directly on Nvidia chips.
At the current $2.662 trillion valuation, Nvidia ( NASDAQ:NVDA ) just needs a 12.8% advance to reach $3 trillion, which would also pass up Apple's current valuation and greatly narrow the gap with Microsoft. Nvidia stock rose 4.5% early Tuesday, pushing the market cap above $2.75 trillion.
The Dow Jones Industrial Average fell Tuesday morning, as Wall Street digested economic data in the form of two housing reports. Artificial intelligence giant Nvidia rallied to more record highs, while GameStop ( NYSE:GME ) soared on the stock market today after raising nearly $1 billion from a stock sale.
Technically, NVIDIA Corp ( NASDAQ:NVDA ) stock is currently overbought with a Relative Strength Index (RSI) of 78.10.

Nvidia"Technical analysis suggests Nvidia may be forming a bull pennant pattern, potentially indicating future price movement within the range of $620-$1100."

(NASDAQ:NVIDIA) STOCK AT $100 POST SPLITTWO POTENTIAL BUYING OPPORTUNITIES UNDER $100
Key Information Breakdown
Stock Split Details
A 10-for-1 stock split means each share will be divided into 10 shares, reducing the price proportionally.
Post-split, the price of NVDA will be more accessible to a broader range of investors.
Current and Projected Prices
Current All-Time High: $1,120.08 per share.
Projected Price Post-Split: $106.425 per share (immediate post-split value).
Potential Price Dip: If the stock drops to fill the gap at $960.20, post-split price would be $96.02 per share.
Support Levels:
Before Split: $750.25
After Split: $75.025
Long-term Projection: Based on projected earnings and a forward earnings multiple of 39, the stock could reach $2,266 per share barring any splits or other significant events.
Potential Price After Five Years
The stock could jump to $58.11 per share after five years, considering typical market conditions and growth prospects.
Historical Performance
Five years ago, NVDA stock was priced at $33 per share.
The stock has since exploded by more than 3,000%, reaching $1,102.44 as of the latest open.
Analysis of Factors
Stock Split Impact
Perception and Accessibility: Lower share prices post-split could attract retail investors who find the new price point more accessible.
Liquidity: Increased number of shares could improve liquidity, making it easier to buy and sell shares without significantly affecting the price.
Market Conditions and Support Levels
Gap Filling: Technical analysis often considers gaps in stock prices as levels that need to be filled, suggesting possible dips to $96.02 post-split.
Support Levels: Strong support levels at $75.025 post-split could act as a safety net, potentially preventing further declines.
Long-term Growth Projections
Earnings Growth: Multiplying projected earnings by Nvidia's five-year average forward earnings multiple suggests substantial long-term growth, with potential stock prices reaching as high as $2,266 per share in five years.
Market Trends: Assuming the broader market trends remain favorable, and Nvidia continues its trajectory in technology advancements and market dominance.
Historical Performance Insight
Nvidia's historical performance shows a significant increase in stock value, with a more than 3,000% rise from $33 per share to over $1,100.00 in five years.
This explosive growth reflects Nvidia's ability to innovate and capture market share in high-growth areas like GPUs, AI, and data centers.
Opportunities to Buy
Under $100 post-split:
Two potential buying opportunities under $100:
If the current all-time high is the peak at 1,120.08 a drop to $960.20 ($96.02 post-split) might occur to fill the gap.
Next strong support level at $750.25 ($75.025 post-split) provides another entry point.
Conclusion
Nvidia's 10-for-1 stock split could significantly impact investor perception, making the stock more attractive and accessible. The historical performance suggests that Nvidia has a strong track record of growth, increasing more than 3,000% over the past five years. While the stock might experience some volatility, with potential dips to $96.02 and support at $75.025 post-split, long-term projections remain robust. Based on historical performance and future earnings estimates, Nvidia's stock could reach impressive highs, potentially hitting $2,266 per share over the next five years. Investors should consider these factors and monitor market conditions for optimal entry points.
🚀🚀Boost this idea to reach more people like you! 🚀🚀
NFA
PLEASE, DYOR/MYOD!!
Hope to See your Likes 👍 to Support My Work
To Follow All My Ideas, Go to My Profile and Select the Follow Green button 😁
Please Re-Evaluate Before Make Your Last Decisions
Check my Profile for more.

NVDA Bull Call Spread (302 DTE) directional playBull Call Spread on NVDA expires May 21st 2025
-1400 +1360
Premium $ 3,178.00 on $ 822.00 or 386% gain, will close early as NVDA continues to rise

NVDA short: Hit Price Target from Fibonacci extensionI had previously mentioned to wait to short NVDA with resistance around $970 and expected their earnings to push the stock to gap up to just below $1000 (I had expected around $991). But good thing is that it gapped up way above the 2 prices mentioned above and actually made a perfect top at the Fibonacci extension level. Meaning if people had waited according to what I said, they could enter the short position at a much more favourable price.
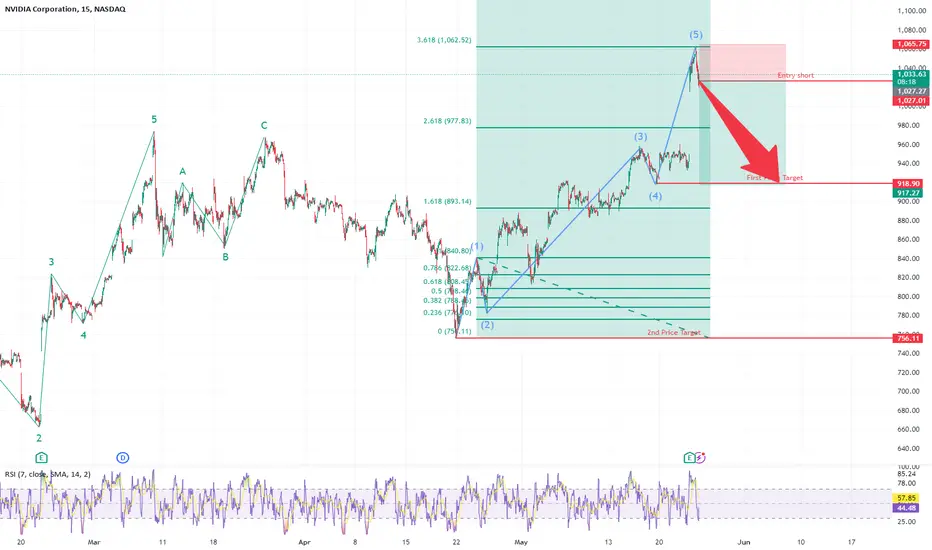
🔥🚀 **NVDA Update 27 May Gap Up Mania or Brief Correction! ** On Thursday, NVDA skyrocketed, smashing through the roof with a new high of 1063.13! By Friday, it closed above the last swing high at 1064.89, signalling a strong continuation of the bullish trend.
Investors are eagerly gearing up for a thrilling Tuesday, anticipating powerful moves ahead. Two exciting scenarios could unfold:
1️⃣ **Gap Up Mania!** 🌟 - With market sentiment glowing with positivity, we might see another gap up, potentially pushing the price to a staggering 1134, mirroring the previous exhilarating gap.
2️⃣ **Bullish Correction!** 📉➡️📈 - Alternatively, a brief correction to 1032 could set the stage for an even stronger uptrend.
The RRG analysis is buzzing with optimism, showing the XLK and SMH sectors in the leading quadrant.
Conclusion:
Get ready!! because NVDA is poised for an electrifying ride! 🌟📈💥

NVDA looks strong NVDA looks to be ready for a bull ride up even one hour is above the 50ema and the daily had a good day on Thursday with bulls holding trades

Can we go back to reality?Congratulations NVDA, because you delivered everything you could deliver in terms of good results, however, can we get back to reality?
Will the Black Monday that we experienced in 1987, in the DOW JONES index, be experienced again in 2024, and thanks to NVDA and technology companies?
We know what happened between 1980 and 1985 to the American economy, right?
It is known that in the 1980s and early 1990s, dollars could circulate freely around the world, so much so that we had a global economic miracle, and the world was swimming in booming growth.
But, at the current moment, dollars can no longer circulate freely around the world (FED, China, Russia) and continue contributing to global growth? Therefore, the technological war we are experiencing today (chips and electric cars), diverted dollars to these sectors, further inflating this bubble that is about to burst.
Speaking of electric cars, China is firmly dumping its electric cars around the world at very reasonable prices (as it has no intention of breaking its internal market – control), once and for all destroying the automobile industry in many emerging countries, oh my, no?
Let's go graphics.
Monthly: NVDA has reached the three golden levels of the FIB of the SETUP used, so there is nowhere else to go. So, SPX, get ready.
The red lines are resistance points.
Weekly: With the brilliant financial report recently released, prices are ready to seek the golden region of this chart period.
The red lines are resistance points.
Daily. Prices have reached the region of 100% of the bullish pivot.
The red lines are resistance points.
Do your analysis and good business.
Be aware, if you buy, use stop loss.
See other graphical analyzes below.

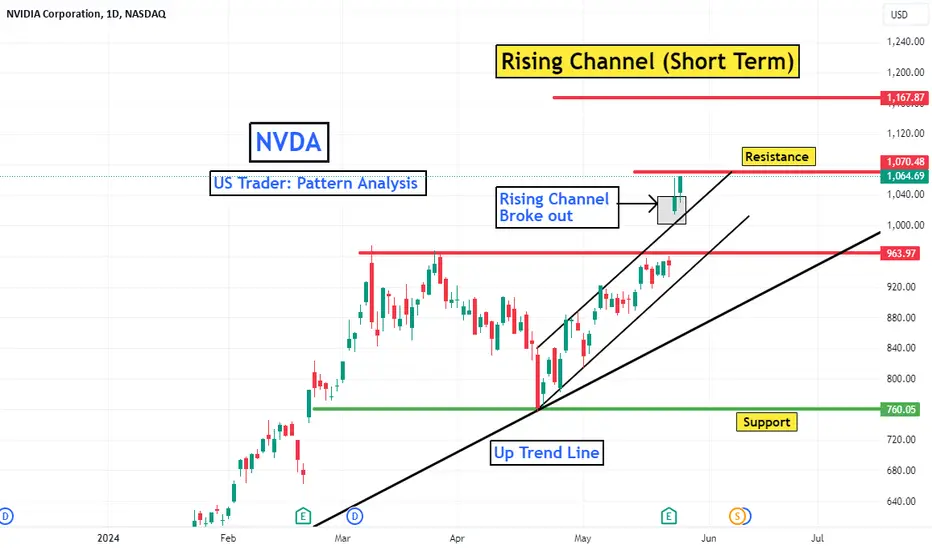
NVDA: Rising Channel (Short Term)Key Points: NASDAQ:NVDA
1. A raising channel shows a clearly defined uptrend. It is generally considered a bullish continuation pattern.
2. A breakout above an ascending channel can signal a continuation of the move higher.
3. A breakdown below an ascending channel can indicate a possible trend change.
Notice :
looking for a job
------------------------
Is Your company hiring an assistant day & swing Trader/ assistant technical analyst/ assistant equity analyst?
I am a day & swing trader, freelancer technical analyst & equity analyst. Now, I am looking for a job .
Skills: Chart analysis, Trend identification, Price pattern recognition, important support and resistance levels identification,
Set up trade idea ( long /short),
Set up entry and target price.
Valuation, making analysis report etc...
Experience: 5 years.
Nvida Back on Track to Reach 1,157My 03/12/24 post illustrated that NVDA could reach 1157. Subsequently NVDA broke important support noted in 04/19/24 post.
The NVDA 05/22/24 earnings report has put the stock back on track to hit what could be major resistance near 1,157.

NVIDIA Technical AnalysisBased on Fibonacci levels, I would not buy NVIDIA at the current price. I believe those who purchased NVIDIA at much lower levels will start to sell around these points, as it appears overvalued with a PE ratio of 88, which is quite high. By only using Fibonacci levels and ignoring the hype of AI, earnings, and news, I could be wrong, but I think the price will decline in the coming months, and we are currently at a top.
Please note, I am not a professional trader, I am just learning.

NVDA: Rising Wedge Pattern/ Date: 26.05.24Key Points:
1. A raising wedge pattern is used to identify possible trend reversals.
2. It is considered a bearish pattern.
3. It signals that the buying momentum is slowing down.
4. 1070 - may act as a resistance.
5. 964 - may act as a support
Notice :
looking for a job
------------------------
Is Your company hiring an assistant day & swing Trader/ assistant technical analyst/ assistant equity analyst?
I am a day & swing trader, freelancer technical analyst & equity analyst. Now, I am looking for a job .
Skills: Chart analysis, Trend identification, Price pattern recognition, important support and resistance levels identification,
Set up trade idea ( long /short),
Set up entry and target price.
Valuation, making analysis report etc...
Experience: 5 years.

NVIDIA IS UNBEATABLEEveryone calls for its inevitable downfall but they keep going stronger and stronger.
For me, its way too dangerous skys are too high and buying for me here would be an act of fomo.
but anyone who invested 200-300-400-500-600 i hope you enjoy the ride because there are no signs of running down.
unlike gamestops nvidia has a really strong foundation to base its money on, so i wouldnt expect a sharp downfall.
please be advised and look for any dips below 200 EMA at 4 hourly charts and daily charts
if theres no sign of any, just enjoy the ride: YOU WON

NVDA-SELL strategy Daily chartI can fully understand the biz doing very well in the AI space. It is clearly a trend setter, and it has benefited from the market conditions it is in. However, we have moved upwards sharply and I feel may see some corrections in the near term.
Strategy SELL @ 1,0850-1,115 and take profit near $ 890 for now. SL according to your entry and risk appetite.

A Golden Age for Splits? Nvidia's MoveNvidia's recent announcement of a 10-for-1 stock split sent ripples through the tech industry. Investors cheered the move, with the stock price surging 9% to a record high. But beyond the immediate impact on Nvidia, Bank of America (BofA) suggests this could be the first domino in a wave of tech stock splits. This article explores the implications of Nvidia's split, the factors driving potential future splits, and the historical trends associated with this strategy.
Nvidia's Split: A Catalyst for Change?
Nvidia's stock price, hovering around $1,000 before the announcement, undoubtedly played a significant role in the decision. With a lower share price after the split, the stock becomes more accessible to individual investors, potentially broadening its investor base. This aligns with BofA's observation that Nvidia is already a favorite among retail investors, according to a May 22 Vanda Research report.
BofA analysts see the split as a positive sign, highlighting a trend of "shareholder-friendly policies" within large-cap tech companies. They also point to historical data suggesting that companies undergoing splits tend to experience strong returns in the following year.
A Landscape Ripe for Splits?
BofA's note identifies 36 companies within the S&P 500 with share prices exceeding $500, potentially making them candidates for future splits. This includes tech giants like Microsoft and Meta Platforms, whose stock prices are approaching that threshold.
There are several factors making the current tech landscape ripe for stock splits:
• Soaring Stock Prices: Fueled by technological advancements and strong demand, many tech stocks have experienced phenomenal growth in recent years. This has pushed share prices to record highs, potentially creating a psychological barrier for some retail investors.
• Accessibility and Liquidity: A lower share price can make a stock more attractive to individual investors, increasing overall trading volume and liquidity. This broader investor base can potentially lead to a more stable stock price.
• Psychological Impact: A lower share price can make the stock appear more affordable, even if the underlying value of the company remains unchanged. This can trigger increased buying interest, particularly among retail investors.
Beyond Price: The Strategic Considerations
While share price is a key factor, companies considering a split should also weigh other strategic considerations:
• Signaling Confidence: A stock split can be seen as a sign of management's confidence in the company's future growth potential. This positive signal can improve investor sentiment and potentially attract new investment.
• Maintaining Momentum: A well-timed split can capitalize on a company's positive momentum, further propelling its stock price upwards. However, a poorly timed split during a market downturn might not yield the desired results.
• Cost and Complexity: Implementing a stock split involves administrative costs and logistical complexities that companies need to consider.
Historical Trends and Potential Outcomes
BofA cites historical data showing that stock splits have generally been followed by positive returns. They argue that splits don't dilute the company's value, but rather make it more accessible to a broader investor base. This can lead to increased trading activity and potentially higher valuations.
However, it's important to note that correlation doesn't imply causation. While past trends suggest positive outcomes, future performance remains subject to market conditions and individual company fundamentals.
The Road Ahead: A Spliting Tech Future?
Nvidia's stock split has reignited the conversation around this strategy within the tech industry. With numerous companies sporting high share prices, BofA's prediction of a potential wave of splits holds merit. This trend, if it materializes, could have several implications:
• Increased Retail Investor Participation: Lower share prices could attract more retail investors to the tech sector, potentially boosting overall market activity.
• Enhanced Liquidity: Broader investor participation can lead to higher trading volumes and improved liquidity for these tech stocks.
• Short-Term Volatility: The implementation of splits could lead to short-term market volatility as investors adjust their positions.
Conclusion
Nvidia's stock split may be a harbinger of a larger trend within the tech sector. Companies with high share prices might consider following suit to broaden their investor base and potentially enhance long-term value. However, the decision to split should be a strategic one, carefully evaluating both the potential benefits and the associated costs and complexities. As the market watches Nvidia's post-split performance, it will be interesting to see if this move ushers in a new era of tech stock splits and how it shapes the investment landscape in the coming years.

⭐NVIDIA - 'Best Buy of the Decade?' (2 years later...) 👈🙄Best feature of Tradingview?
That everything stays, nothing can be amended or edited or deleted.
⏰ Jul 15, 2021:
⭐NVIDIA - Best Buy of the Decade? ⭐⭐⭐⭐ :
Some of the comments back then were:
❤️🩹Short it or you will regret it
❤️🩹It was a great buy few years ago. Key word, WAS.
❤️🩹holy f, have you done some valuation analysis? god tier company, the future of mankind. but stock=/=company, insanely overpriced
2 Years later everyone talks about NVIDIA as AI brings near a trillion-dollar valuation.
No further comment other than that i see Major resistance at 449-470$
One Love,
the FXPROFESSOR ⭐🙄

NVDA - making all time high daily till split day on 10 Jun 2024?NVDA - making all time high daily till split day on 10 Jun 2024?

NVDA waves from its first day.Hello
The main difference between Elliott and the other techniques is to draw a complete map from the start through the future of the market and none of other methods can do that.
If this counting is correct or not wont change this rule and whenever our markings is incorrect we just need to repaint instead of changing our methods.
For now this what I have labelled for NVDA and it might change in the next week.
Red cycle counting is an alternative and red level is its invalidation area.
Just Keep your Balance safe
