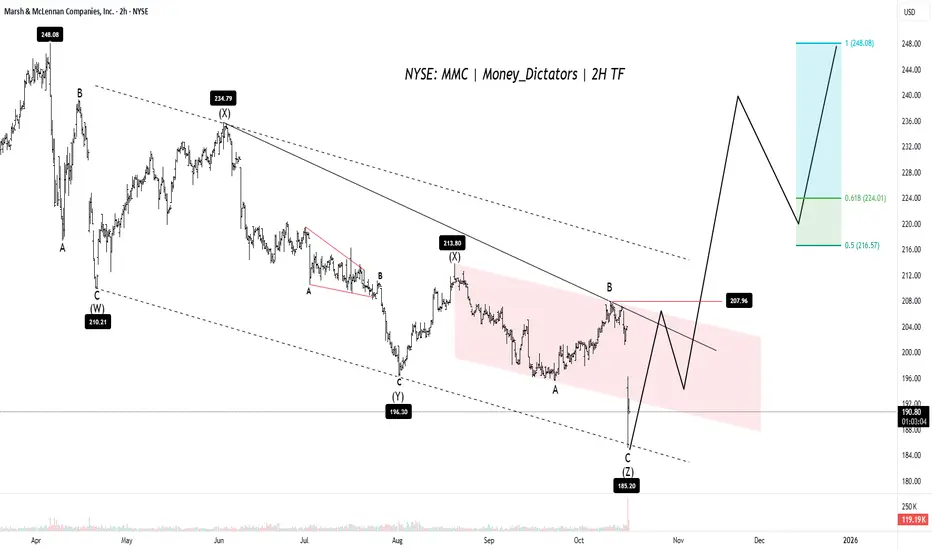
What Should You Expect From MMC?MMC is nearing the end of a recent price drop. The price is currently in its final downward phase, expected to bottom out around $184 to $186. Targets are 219, 234 & 245. Bulls can take control at wave B point(Resistance - $207).
If the price successfully holds above this $184–$186 support, the
Next report date
—
Report period
—
EPS estimate
—
Revenue estimate
—
7.1538 EUR
3.92 B EUR
23.58 B EUR
489.51 M
About Marsh & McLennan Companies, Inc.
Sector
Industry
CEO
John Q. Doyle
Website
Headquarters
New York
Founded
1871
ISIN
US5717481023
Marsh & McLennan Cos., Inc. is a professional services firm, which engages in offering clients advice and solutions in risk, strategy, and people. It operates through the Risk and Insurance Services, and Consulting segments. The Risk and Insurance Services segment is involved in risk management activities, as well as insurance and reinsurance broking and services. The Consulting segment offers health, wealth, and career solutions and products, and specialized management, strategic, economic, and brand consulting services. The company was founded by Henry W. Marsh and Donald R. McLennan in 1871 and is headquartered in New York, NY.
Related stocks
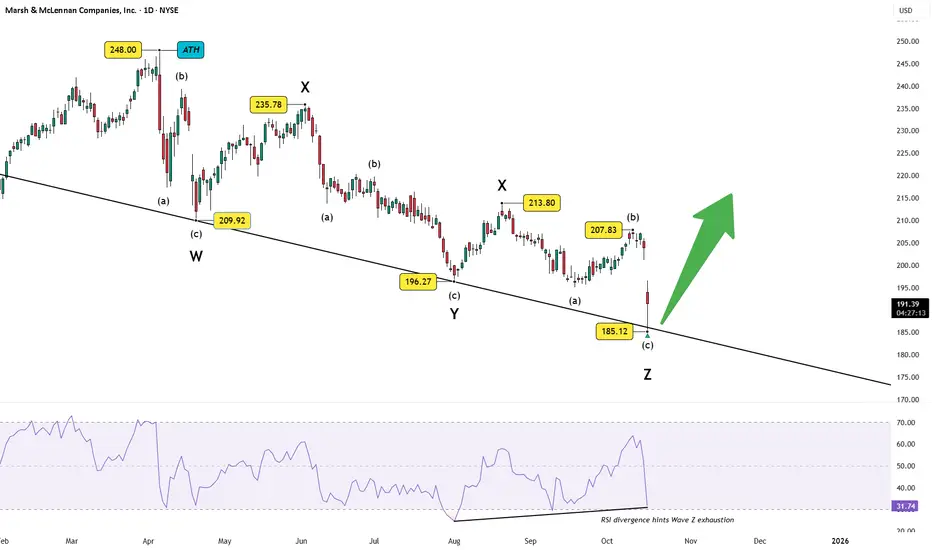
Marsh & McLennan (MMC): Complex Correction Nearing CompletionWave Structure
The larger decline from the 2024 peak at 248.00 appears to have unfolded as a five-part complex combination (W–X–Y–X–Z) .
Each leg subdivides neatly into corrective (a–b–c) formations, with Wave Z recently tagging the long-term support trendline connecting prior W–Y lows around 18
MMC / Marsh % McLennan / Seasonality & FractalMy analysis gives me a hint that MMC could go up to the marked area. The upmove, from aseasonality point of view could finish around beginning of December.
After reaching the price and time downlside is coming. The bearhish period in PE+2 year should bring price down to break the double low until e

MMC Too late for now?This is my view how this may play out the next weeks.
no good entry idea coming to my head now. let's see. let's discuss, i d be happy to chat with you guys or read your comments.
cheers!

$MMC with a bullish outlook following its earnings #StocksThe PEAD projected a bullish outlook for NYSE:MMC after a positive over reaction following its earnings release placing the stock in drift B with an expected accuracy of 60%.

Watching the support to the channel for continuation sidewayMoving back up after consolidation is possible as the framework, pivot point, and oversold levels are ready to regain momentum. Very conservative as it is still high and still inside the channel.

UpdatE: MMC, bought, Take Profit +8.12%, STOP Loss -1.59% NYSE:MMC
UpdatE: MMC, bought, Take Profit +8.12%, STOP Loss -1.59%


$MMC with a bullish outlook following its earnings #StocksThe PEAD projected a bullish outlook for NYSE:MMC after a negative over reaction following its earnings release placing the stock in drift C with an expected accuracy of 60%.

Marsh & McLennan Companies (MMC) Weekly Chart AnalysisCompany: Marsh & McLennan Companies
Ticker: MMC
Exchange: NYSE
Sector: Financial Services
Introduction:
Hello and thank you for taking the time to read my post. Today, we analyze the Marsh & McLennan Companies (MMC) chart on the weekly scale, focusing on a classic price pattern called the "Rect

See all ideas
Summarizing what the indicators are suggesting.
Neutral
SellBuy
Strong sellStrong buy
Strong sellSellNeutralBuyStrong buy
Neutral
SellBuy
Strong sellStrong buy
Strong sellSellNeutralBuyStrong buy
Neutral
SellBuy
Strong sellStrong buy
Strong sellSellNeutralBuyStrong buy
An aggregate view of professional's ratings.
Neutral
SellBuy
Strong sellStrong buy
Strong sellSellNeutralBuyStrong buy
Neutral
SellBuy
Strong sellStrong buy
Strong sellSellNeutralBuyStrong buy
Neutral
SellBuy
Strong sellStrong buy
Strong sellSellNeutralBuyStrong buy
Displays a symbol's price movements over previous years to identify recurring trends.
MMC5552133
Marsh & McLennan Companies, Inc. 5.45% 15-MAR-2053Yield to maturity
5.44%
Maturity date
Mar 15, 2053
MMC5494060
Marsh & McLennan Companies, Inc. 6.25% 01-NOV-2052Yield to maturity
5.42%
Maturity date
Nov 1, 2052
MMC5930471
Marsh & McLennan Companies, Inc. 5.4% 15-MAR-2055Yield to maturity
5.40%
Maturity date
Mar 15, 2055
MMC5647797
Marsh & McLennan Companies, Inc. 5.7% 15-SEP-2053Yield to maturity
5.38%
Maturity date
Sep 15, 2053
MMC4786492
Marsh & McLennan Companies, Inc. 4.9% 15-MAR-2049Yield to maturity
5.37%
Maturity date
Mar 15, 2049
MMC5754704
Marsh & McLennan Companies, Inc. 5.45% 15-MAR-2054Yield to maturity
5.36%
Maturity date
Mar 15, 2054
MMC4606282
Marsh & McLennan Companies, Inc. 4.2% 01-MAR-2048Yield to maturity
5.35%
Maturity date
Mar 1, 2048
MMC4443339
Marsh & McLennan Companies, Inc. 4.35% 30-JAN-2047Yield to maturity
5.35%
Maturity date
Jan 30, 2047
MMC5314900
Marsh & McLennan Companies, Inc. 2.9% 15-DEC-2051Yield to maturity
5.31%
Maturity date
Dec 15, 2051
MMC5930470
Marsh & McLennan Companies, Inc. 5.35% 15-NOV-2044Yield to maturity
5.10%
Maturity date
Nov 15, 2044
MMC4786489
Marsh & McLennan Companies, Inc. 4.75% 15-MAR-2039Yield to maturity
4.94%
Maturity date
Mar 15, 2039
See all 858415 bonds
Curated watchlists where 858415 is featured.

Frequently Asked Questions
The current price of 858415 is 160.9500 EUR — it has increased by 0.06% in the past 24 hours. Watch Marsh & McLennan Companies, Inc. stock price performance more closely on the chart.
Depending on the exchange, the stock ticker may vary. For instance, on LSX exchange Marsh & McLennan Companies, Inc. stocks are traded under the ticker 858415.
858415 stock has fallen by −7.43% compared to the previous week, the month change is a −2.02% fall, over the last year Marsh & McLennan Companies, Inc. has showed a −22.51% decrease.
We've gathered analysts' opinions on Marsh & McLennan Companies, Inc. future price: according to them, 858415 price has a max estimate of 221.59 EUR and a min estimate of 164.05 EUR. Watch 858415 chart and read a more detailed Marsh & McLennan Companies, Inc. stock forecast: see what analysts think of Marsh & McLennan Companies, Inc. and suggest that you do with its stocks.
858415 reached its all-time high on Mar 3, 2025 with the price of 228.4000 EUR, and its all-time low was 157.5500 EUR and was reached on Oct 17, 2025. View more price dynamics on 858415 chart.
See other stocks reaching their highest and lowest prices.
See other stocks reaching their highest and lowest prices.
858415 stock is 1.81% volatile and has beta coefficient of 0.42. Track Marsh & McLennan Companies, Inc. stock price on the chart and check out the list of the most volatile stocks — is Marsh & McLennan Companies, Inc. there?
Today Marsh & McLennan Companies, Inc. has the market capitalization of 79.34 B, it has decreased by −7.00% over the last week.
Yes, you can track Marsh & McLennan Companies, Inc. financials in yearly and quarterly reports right on TradingView.
Marsh & McLennan Companies, Inc. is going to release the next earnings report on Jan 22, 2026. Keep track of upcoming events with our Earnings Calendar.
858415 earnings for the last quarter are 1.58 EUR per share, whereas the estimation was 1.52 EUR resulting in a 3.73% surprise. The estimated earnings for the next quarter are 1.71 EUR per share. See more details about Marsh & McLennan Companies, Inc. earnings.
Marsh & McLennan Companies, Inc. revenue for the last quarter amounts to 5.41 B EUR, despite the estimated figure of 5.39 B EUR. In the next quarter, revenue is expected to reach 5.65 B EUR.
858415 net income for the last quarter is 636.59 M EUR, while the quarter before that showed 1.03 B EUR of net income which accounts for −38.08% change. Track more Marsh & McLennan Companies, Inc. financial stats to get the full picture.
Yes, 858415 dividends are paid quarterly. The last dividend per share was 0.77 EUR. As of today, Dividend Yield (TTM)% is 1.78%. Tracking Marsh & McLennan Companies, Inc. dividends might help you take more informed decisions.
Marsh & McLennan Companies, Inc. dividend yield was 1.49% in 2024, and payout ratio reached 38.54%. The year before the numbers were 1.44% and 36.14% correspondingly. See high-dividend stocks and find more opportunities for your portfolio.
As of Oct 24, 2025, the company has 90 K employees. See our rating of the largest employees — is Marsh & McLennan Companies, Inc. on this list?
EBITDA measures a company's operating performance, its growth signifies an improvement in the efficiency of a company. Marsh & McLennan Companies, Inc. EBITDA is 6.54 B EUR, and current EBITDA margin is 28.15%. See more stats in Marsh & McLennan Companies, Inc. financial statements.
Like other stocks, 858415 shares are traded on stock exchanges, e.g. Nasdaq, Nyse, Euronext, and the easiest way to buy them is through an online stock broker. To do this, you need to open an account and follow a broker's procedures, then start trading. You can trade Marsh & McLennan Companies, Inc. stock right from TradingView charts — choose your broker and connect to your account.
Investing in stocks requires a comprehensive research: you should carefully study all the available data, e.g. company's financials, related news, and its technical analysis. So Marsh & McLennan Companies, Inc. technincal analysis shows the sell today, and its 1 week rating is strong sell. Since market conditions are prone to changes, it's worth looking a bit further into the future — according to the 1 month rating Marsh & McLennan Companies, Inc. stock shows the neutral signal. See more of Marsh & McLennan Companies, Inc. technicals for a more comprehensive analysis.
If you're still not sure, try looking for inspiration in our curated watchlists.
If you're still not sure, try looking for inspiration in our curated watchlists.