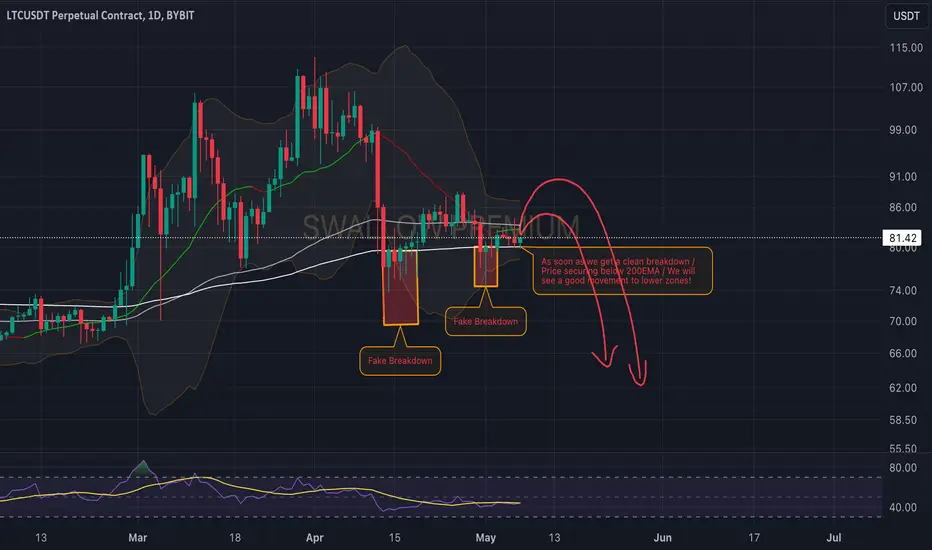
Litecoin (LTC): Keep an Eye on 200EMA!!!!Litecoin is back, and this time in the daily timeframe.
Here, our attention is all on that 200EMA, while multiple times it has been a zone of bounce for the coin.
Pressure is high and demand is high in that zone, so we are looking for any potential candles to secure this zone fully in order to
🌟📉 "Litecoin Analysis: The Oldest Coin in the Market" 📊💰🕵️♂️ Let's delve into the analysis of Litecoin, one of the oldest cryptocurrencies, which has managed to remain in the top 50 coins. We'll analyze it for trading in futures.
📈 In higher time frames, Litecoin remains within its box, similar to some other cryptocurrencies. After breaking the resista

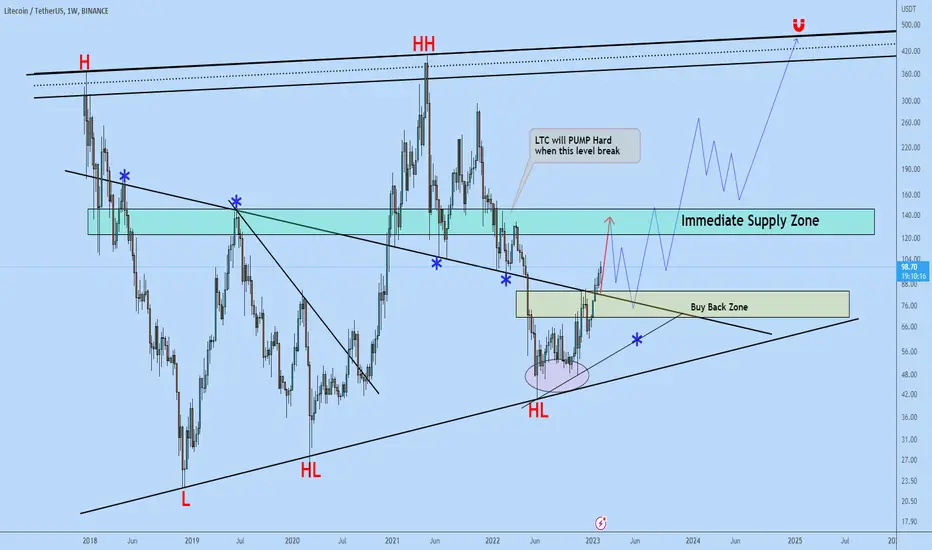
💎 LITECOIN (LTC) - Investment Opportunity (READ THE CAPTION)Upon examining the #Litecoin chart on a weekly timeframe, we can see that the price is currently trading around $81.5 and there is still an opportunity for further analysis for long-term investment. The demand zones are respectively from $67 to $72 and $53 to $59, while the supply zones are $93.8, a

Best Risk/Reward ratio of MayThis is my third and final attempt at a Litecoin pump, this coin seems to be ready for a huge green redacted candle.
I'm buying with low size and will increase as it begins moving favorably. This trade should last around 3 months.
P.S yes, i'm serious with that tight stop-loss.
LFG

LITECON UPDATE - SHORT SETUP
now that daily bullish engulfing is what I have been expecting if this was going to be a wave 4-green Triangle. We now have a new invalidation level ($84.18) which presents us with a better risk reward ratio than before (3RR).
PREVIOUS ANALYSIS
OTHER ANALYSIS

Ltcusdt in potential Ascending setupPrice has been forming a series of higher highs and higher lows and this is positive sign and indicates increased demand and confidence among buyers.
Therefore, LTC is very bullish. All attention should be on this immediate support level

LITECOIN UPDATE
Contrary to the previous setup, I have seen a scenario where the invalidation level could become a stop hunt, so what to do is simple; either cut position in half to reduce risk or hedge it with a spot or just close the entire position right now at a minimal loss. BINANCE:LTCUSDT
PREVIOUS ANALYS

LTC continues to lose bullish steamLTC continues to lose bullish steam
The price was brokeout by a complex pattern and currently confirmed a bearish wave.
It may be temporary, but it may also move further down to the second target.
We have seen several times that LTC suffers from the bullish volume problem.
On the other hand als

✅ A massive rally is comingBullish structure
Pullback completed
BTC & ETH is bullish too
I got long position confirmation

See all ideas