Ltc ready to goif ltc can break the downtrend here we could see a massive move up here, especially leading up to the ltc halving
LTCUSDT trade ideas

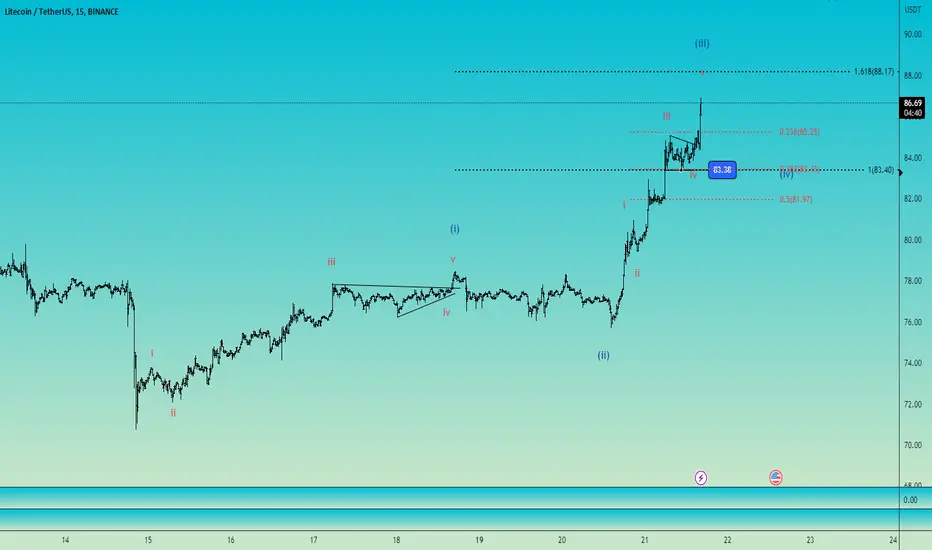
Litecoin 15 min Elliott wave countLitecoin may hit soon 1.618 fib extension to end an impulse that may be the 3rd wave.
Pivot point to the 4th wave 83.36, if will break down I doubt that this trend will continue upwards. keep in mind this!!!
I will put updates soon as will see more price action!!
Hit the like button if you like my analysis and follow me for future updates!
Good luck!
LTC/USDT Waiting for that touch there! Hey traders 👋
LTC/USDT is going to be the starter of the day where we see a nice flag where we see loweer highs and higher lows forming with every push and drop!
We are looking here for that upper zone of $94 to be filled for a potential nice drop to happen here! What do you think guys? - Remember EMAs have been clearly broken here!
If you like ideas provided by our team you can show us your support by liking and commenting.
Yours Sincerely,
Swallow Team
Disclamer:
We are not financial advisors. The content that we share on this website are for educational purposes and are our own personal opinions.

LitecoinLitecoin has been in this channel since last May. We hit the bottom of the channel and saw a rally up. We can expect Litecoin to rally to the top of the channel and see what happens there weather its a rejection or breakout.

LTC has bullish flagLocal level on a round number. The instrument is growing in volume, there is activity in the glass. At the moment, a local level has been formed with two touches in the continuation of the long movement. The graph clearly shows the trend of impulse exits from such consolidations. I recommend going in after breaking through the level.

Litecoin bullish wave can't be ignored!! 👀 🚀LTC Today Analysis💎LTC is currently on a promising trajectory, forming an ascending channel, and there's a strong possibility it might continue to follow the Elliot Wave pattern from 1-5.
💎It's trading in a high-demand zone, which further bolsters the bullish outlook.
💎keep an eye on the lower low area - if the price breaks below this, it could signal a shift out of the bullish momentum.
💎In the dynamic world of crypto, staying informed and adaptable is key. Stay tuned for more updates and enjoy your trading journey!

LTCUSDT LONGHi there,
I like to share you my idea of my long setup for LTC.
As the halving is getting closer, we might have a good opportunity for a long position insight.
(Blue vertical line LTC Halving)
(Gold vertical line BTC Halving)
As we know from history, after the last LTC halving the price decrease.
We were in a bear market at that time. After the BTC halving, the price of LTC increase. With the ath between the 2 halvings.
So IF history is respected , we might see a little pump to restistance, then back to what i THINK is the bottom ( redline ).
And then off we go to the MOON??
I will enter in the green box on the bottom line, and exit around $ 120.
I would love to hear your comments on my charts.
I would love that (L)
Follow for more.

LTC: 🦝 Entering the Halving Cycle First 🌓Litecoin Sees 55% Increase In New Daily Addresses As Bullish Sentiment Grows:
Bullish sentiment around Litecoin has been on the rise as the network is drawing closer to its much-anticipated halving event. This positive sentiment is reflected in the number of new daily addresses on the blockchain, which has seen a significant rise over the last week.
Understanding Upcoming Litecoin Halving:
Litecoin’s halving is set for August 26.
In anticipation, wallet addresses and active users are skyrocketing.
Historically, price action has always followed halvings – but predicting when is tricky.
Halving events in cryptocurrency always garner a lot of attention with their rarity and impact to supply and demand. One of the older coins will have its fourth-ever halving in the coming weeks.
Litecoin, along with another major coin – Bitcoin – always has price action conversations attached to the halvings that have come before. Patterns seem to point to price rises following a halving, but the timing of the rises is difficult to predict.
Historical data reveals that previous Litecoin halvings did not immediately result in significant price surges for LTC. After the 2015 halving event, the price of Litecoin remained relatively steady until the middle of 2017, when Bitcoin embarked on a remarkable bull run that dominated the markets during that time.
Similarly, the second halving also led to a period of price stability before the broader cryptocurrency markets experienced a bull market in 2021.
🦝To my buddy Dave aka the Raccoon.... and future (maybe) partner to be.
One Love,
The FXPROFESSOR🌓
links:
www.newsbtc.com
dailycoin.com

Litecoin shortLitecoin bounced off the resistance level. Asset bounced down off the bearish trendline. Decline to support level at 72 is expected to happen.

Litecoin Long-Term Bullish: $270 Target in Next Bull MarketLitecoin Bullish Chart Analysis
Litecoin (LTC) is currently trading at $77.50. According to a technical analysis by CryptoPatel, the price is expected to move 30-40% down from here before skyrocketing.
The analysis is based on the rising wedge pattern, which is a bearish continuation pattern. If the price breaks down the rising wedge pattern, we could see a drop to $65 and $51.
The analyst recommends buying Litecoin at $60-$65 or $51. The target price is $100 after hitting both buy zones. The next target is $270 in the next bull market.
However, there is some risk in the short term. The price could break down below $51 and go even lower ( which will best buying price ). Therefore, it is important to do your own research before investing in any coins.
Here are the key levels to watch:
Support: $51
Resistance: $100
Disclaimer: This is not financial advice. Do your own research before investing in any coins.
Additional notes:
CryptoPatel is a well-known cryptocurrency trader and analyst.
Technical analysis is the study of historical price movements to predict future price movements.
Technical analysis is not always accurate, and there is always the risk of losing money when investing in cryptocurrencies.
Follow us for More Quality Analysis.
Thank you.


LTCUSDT ⚠️"Litecoin has lost three important and primary supports in its recent decline. There is one significant static support at a price of $75 and two trendline supports indicated by red and yellow colors on the chart.
Currently, the price is below all three previous supports, and naturally, they will now act as resistances. In my opinion, if today's candle closes below these three lines, we should expect further decline and a fall towards the main trendline, represented by the green color on the chart.
Therefore, today's candle is crucial for me, and if it doesn't return above the support lines, I will be looking for a selling point."
⚠️"Daily crypto market analyses I provide are personal opinions & not financial advice. Trading carries risks, so do your own research & seek advisor's help."


Ltc usdt in long term 1 d time frame Ltc is at its minor support area if it not hold this trend line then we see ltc move down side to the lower but strong trend line.

Ltc usdt short in low time frame of 1hr Ltc is forming berish flag and also faceing the resistance if ltc will not break this small zone we will see a down. Trend

Litecoin's price looks really...LITEBINANCE:LTCUSDT
Litecoin encountered selling pressure as it turned down from the moving averages and broke below the support line of a symmetrical triangle pattern on June 10. This decline signaled the bears overpowering the bulls. Although the LTC/USDT pair is attempting a bounce from the horizontal support at $75, the inability of the bulls to push the price back into the triangle suggests that the bears are selling during minor rallies.
This raises the likelihood of a further drop below $75, with the next significant support at $65. Alternatively, if the price reverses from the current level and reenters the triangle, it would indicate a potential bear trap. Positive momentum may strengthen once the bulls push the price above $91.50.

ltcusdtltcusdt may form deepcrab harmonic pattern on 3day chart pattern .the best performing alt in this drop in crypto .


#LTCUSDT #LQR #TOBTC #LaqiraProtocol● If confirm it can drop up to the specified support
● This analysis is not a buy or sell offer

Bearish flag? This pattern is showing in most of the cryptocurrency. can it be just market makers are manipulating to retail traders to go bearish side and liquidate them ?

A Short idea for LtcUsdtHi first of all do your own research before any action...
ltcusdt can drop again after breaking support zone..
we will wait and see whats happening...
