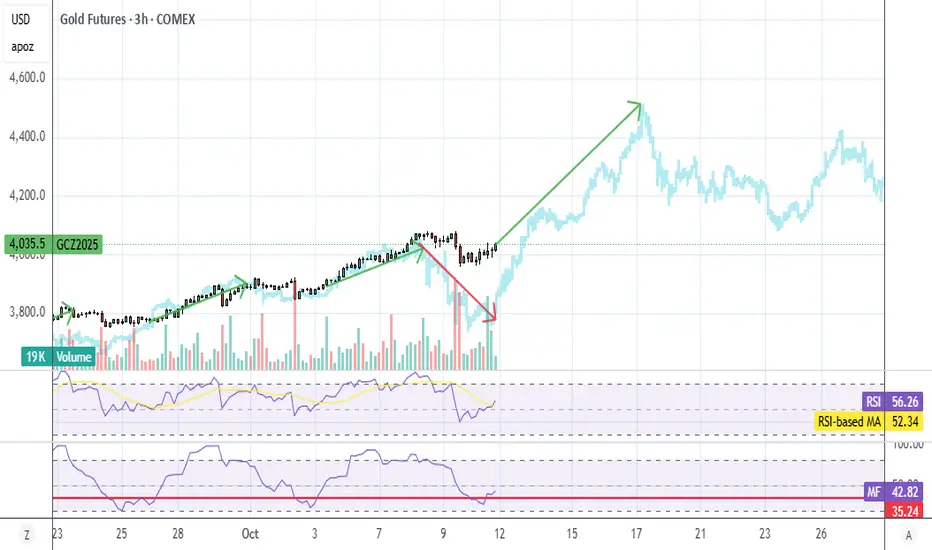
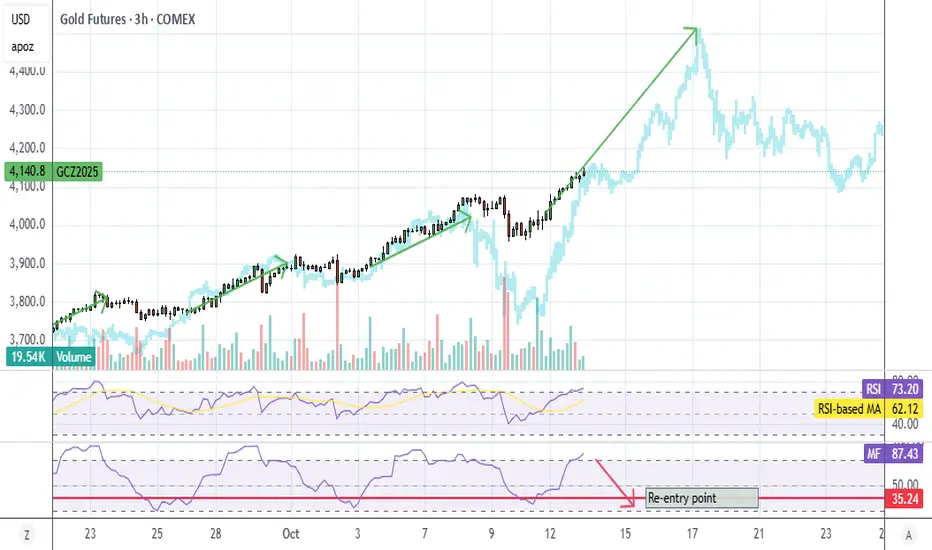
Gold GC1 UpdateI said earlier this week that it's supposed to drop but will wind up going sideways instead and it did. I put my money where my mouth is, and went long on GLD calls and ETF because my MFI indicator went oversold then crossed back over the red line.
We'll see if I'm right or not and if the 3hr MFI indicator actually works as well as I think it does. Bought 30 GLD call contracts and 2k shares of GLD, so it's a very sizeable bet.
Trade ideas
Long trade
1Hr TF overview
📘 Trade Journal Entry
Pair: MGC1! (Micro Gold Futures)
Direction: Buyside Trade
Date: Fri 10th Oct 2025
Time: 12:00 PM
Session: LND to NY Session AM
Timeframe: 1-Hour
🔹 Trade Details
Entry: 3,998.3
Profit Target: 4,373.6 (+9.39%)
Stop Loss: 3,972.4 (–0.63%)
Risk-Reward Ratio (RR): 14.9
⚙️ Model Context
Model 010 – Sweep / Trigger / Entry
Setup Sequence:
Price swept the prior swing low and formed a liquidity grab near the breaker block and demand zone. Clear CHOCH (Change of Character) confirmed on 1H timeframe.
Fib retracement alignment with the 0.618–0.705 zone, providing ideal re-entry confirmation.
Volume expansion occurred at breakout, supported by sustained EMA/WMA alignment.
Structure maintained a strong ascending trendline respecting 50EMA and 200WMA support.
🧭 Narrative Context
Price consolidated in the mid-3,900s region following an extended accumulation phase, with multiple FVGs (Fair Value Gaps) and a high-volume zone below acting as structural support.
Institutional order flow confirmed by consistent re-accumulation and sweep of internal liquidity pockets.
Projection levels 4,259 → 4,373 (Fib 2.618–3.618) highlight continuation potential, targeting extended buyside liquidity above 4,300.
📊 Outcome (as of chart timestamp)
Current price hovering near 4,260+, validating trajectory towards projected extension levels.
Trade remains in the upside continuation phase with structural integrity intact above the 4,120 WMA. Trump’s “Trade War 2.0” rhetoric, combined with renewed geopolitical and tariff tensions, is reviving safe-haven demand. TSM earnings volatility and an anticipated Federal Reserve speech could amplify market uncertainty — typically, this may translate into accelerated gold inflows.

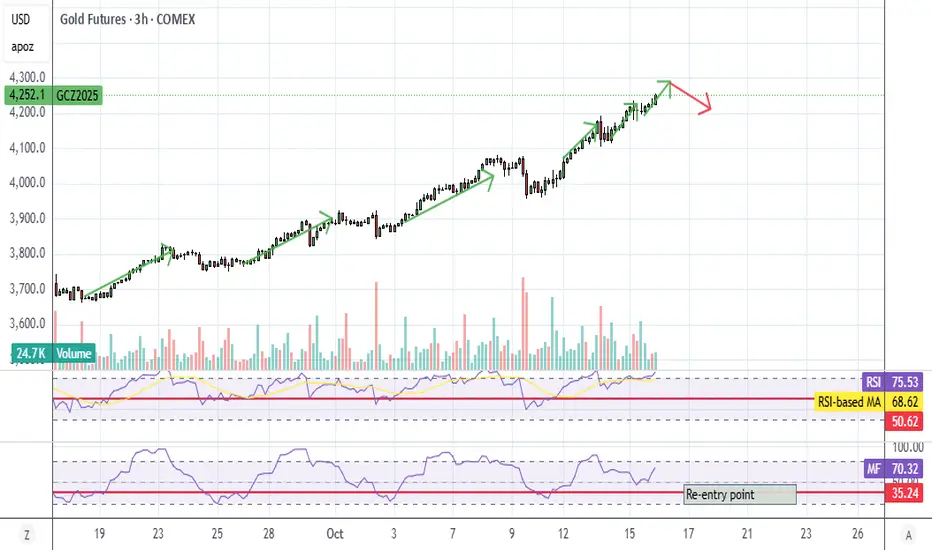
GC Update againSurprised they're pumping it again tonight. Appears MFI is not going to hit my red line, they're just gonna melt it up with no real drops.
Missed out, but I'd rather go big on a sure bet than hold a small position continuously. There's no way I'd have sunk $700k into gold for a long term play, though in hindsight I wish I had, lol
Gold keeps climbing strongly above the 4,100 USDGold keeps climbing strongly above the 4,100 USD
On the weekly chart (Gold Futures – COMEX), we can clearly see a strong bullish trend supported by high volume and positive market sentiment.
The arrows mark key technical moments:
Moving average crossovers – every time these lines crossed or touched, a price correction followed.
Support retests – often provided great buying opportunities after pullbacks. Current impulse – price is far above the moving averages, which could suggest a medium-term correction risk.
Historically, these points have marked short-term pullbacks, while the overall trend stayed positive.
OkNext potential target: around 4,400 USD

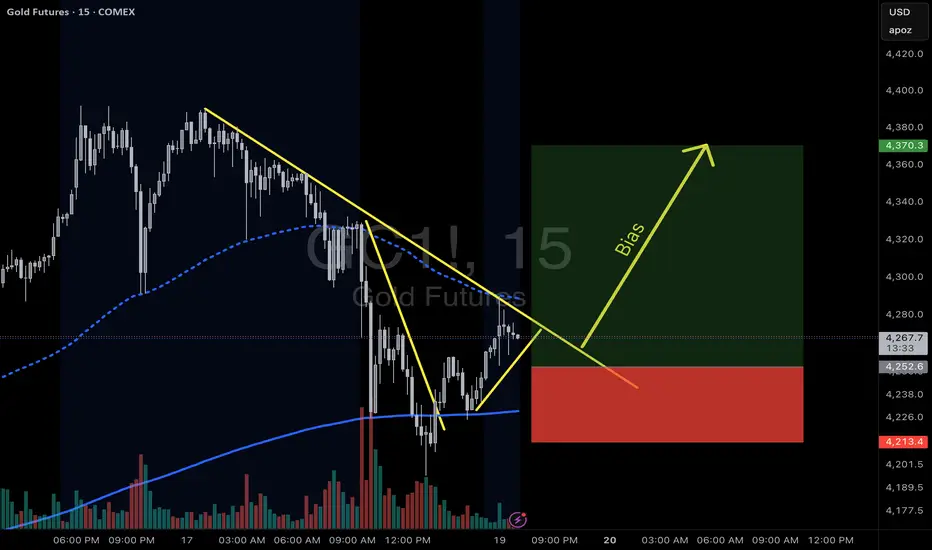
Weekly Outlook — Gold Futures (MGCZ2025)Price is sitting between key levels after last week’s explosive move.
I’m watching 4,300 as immediate resistance — if bulls can’t hold above this level, I expect a sweep toward 4,200–4,150 (H4 + Daily FVGs) before continuation.
Monday might just be a setup day, building liquidity for a Tuesday/Wednesday move.
Key Levels:
🟦 4,392 – Previous Weekly High
🟨 4,300 – Near-term resistance
🟧 4,200 – Daily Low / Support zone
🟩 4,150 – H4 FVG top
Let’s see how Monday sets the tone for the week.
#Gold #Futures #TradingPlan #ICT #PriceAction

Gold , final top $8500 area. Still on track !Gold , final top is in the $8500 area top based on the chart. Still on track with corrections and consolidations along the way. Then big bear market with a low of $2500 and then new bull. Not for trading

GC UpdateWaiting for re-entry, I was looking at the chart again, and it looks like RSI has to hit 50 AND MFI has to cross my red line before it's time to buy. Also, I recommend buying when it crosses back OVER the line, not on the way down. You don't need to time the exact bottom to make money.
It's looking a lot like tomorrow afternoon or Thu morning. I can't update during the day, but I will post a comment.
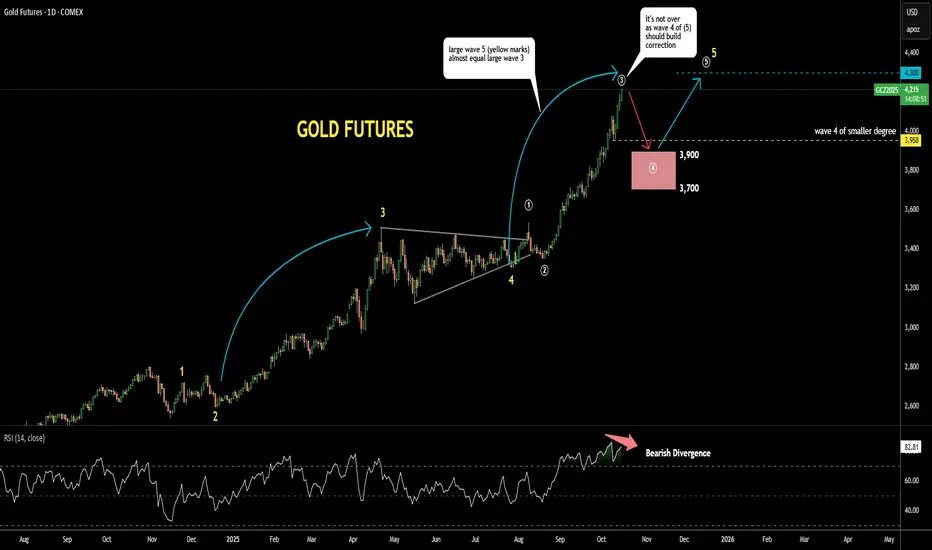
Gold Update 15OCT2025: RSI Hints at CorrectionGold continues to dominate headlines, printing new all-time highs one after another
The 4-hour Bearish Divergence earlier failed to halt the rally
Now, a Bearish Divergence has appeared on the daily time frame, as the latest price high was not confirmed by RSI
This signals that a peak may be forming
A corrective phase could soon unfold as wave 4 within the larger wave (5) structure
The expected retracement could reach the 38.2–61.8% Fibonacci zone of wave 3 of (5), targeting the pink box between $3,700 and $3,900
The low of the previous minor wave 4, near $3,958, may serve as initial support during the pullback
It is worth noting that the magnitude of wave (5) so far mirrors that of the prior large wave (3)
Therefore, the projected target for the final wave 5 of (5) remains around $4,300 as a conservative objective
However, if momentum extends further, wave 5 could evolve into an extended move and drive prices toward new record highs beyond that level
Gold GC1 UpdateI cashed out after lunch because RSI and MFI hit overbought. Chances are we won't see much of a dip if it behaves like it's been behaving, but I had waaaay too much money in it to take a chance.
Might just do options next time and not bet my house, lol. Plenty of money to be made without throwing $700k into it. (I had 2k shares of GLD)
Gold Still Running Hot — No Real Pullback YetPrice exploded out of the 15m FVG during Thursday’s Asian session and hasn’t looked back. Took a long right off that 8PM impulsive candle, scaling in as we broke back above the Previous Daily High.
Now we’re holding steady above 4345 — the midpoint of the Asian range looks like short-term support. If bulls defend this level, we could see continuation toward 4380–4400.
Friday bias: Bullish, unless 4340 gives out.
No clean pullback = no reason to force entries. Let the market prove it.
#GoldFutures #MGC #ICTConcepts #NOFOMO #DayTrading

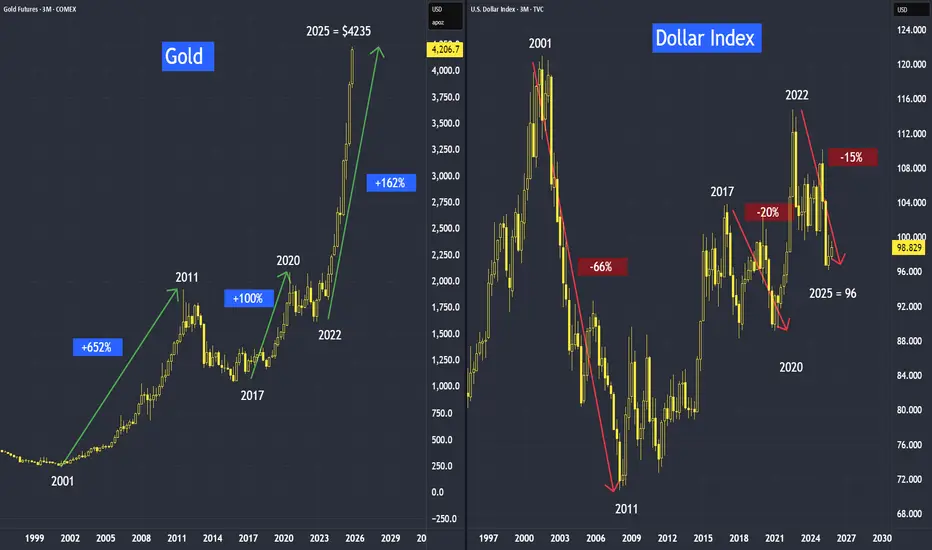
How High Will Gold Go? It Depends on the DollarThe inverse relationship between gold and the dollar is evident. Interestingly, we observe that when the dollar falls, gold rises—but the magnitude of gold’s increase is often greater than the dollar’s decline.
As we can see when dollar declines, gold went up.
From 2001 to 2011, when dollar was down, gold went up.
From 2017 to 2020, when dollar was down, gold went up.
And from 2022 to current, when dollar is down, gold is up.
With de-dollarization, this also means gold may have more upside potential.
Conversely, when the dollar increases, gold declines by almost the same magnitude.
Apart from de-dollarization, what are the other reasons dollar will face more headwinds?
There are three elements
• Existing debt,
• more money printing and
• tariffs,
All these 3 elements are not going to go away anytime soon, as long as the debt continue to rise, more money to be printed and more tariffs impose, dollar downtrend is likely to continue. When dollar is down, gold is up.
And these trends did not happen recently. It is taking shape over the past decades with a lower dollar, we can see how nicely the trends have seated on its historical troughs and peaks forming the channel for the dollar, and also in the gold over the decades.
This tutorial video version:
Mirco Gold Futures and Options
Ticker: MGC
Minimum fluctuation:
0.10 per troy ounce = $1.00
Disclaimer:
• What presented here is not a recommendation, please consult your licensed broker.
• Our mission is to create lateral thinking skills for every investor and trader, knowing when to take a calculated risk with market uncertainty and a bolder risk when opportunity arises.
CME Real-time Market Data help identify trading set-ups in real-time and express my market views. If you have futures in your trading portfolio, you can check out on CME Group data plans available that suit your trading needs www.tradingview.com
Asian Session Prep | Price Holding Above Yesterday’s HighNew day, new opportunity — and the bulls are still in control.
Price broke above yesterday’s high before the Asian killzone, showing strong intent early. Now, as we move into the session, it looks like we’re setting up for a continuation — using the previous Daily High (4234.7) as intraday support.
I’ll be watching for a clean reaction around that level during the next impulsive hour. As long as price continues respecting that structure, I’ll maintain a bullish bias.
💡 Key Notes:
Setup: Killzone Continuation
Bias: Bullish
Key Level: 4234.7 (Previous Daily High → Support)
Session Focus: Asian Killzone (8PM–11PM CST)
Target Zones: 4250 short-term, 4280 stretch target
Blind Spot: Price might retrace deeper before expansion — watch for liquidity sweeps near 4220 before continuation.
#Gold #Futures #DayTrading #PriceAction #AsianSession #KillzoneTrading #NoFOMO #Discipline #ICTInspired #TraderMindset

GOLD (XAUUSD): Bullish! IRL To ERL! Look For Buys!In this Weekly Market Forecast, we will analyze the Gold (XAUUSD) for the week of Oct. 13-17th.
Gold is bullish on all HTFs. Selling is not an option. Moving from IRL to ERL. Only buys are valid.
Enjoy!
May profits be upon you.
Leave any questions or comments in the comment section.
I appreciate any feedback from my viewers!
Like and/or subscribe if you want more accurate analysis.
Thank you so much!
Disclaimer:
I do not provide personal investment advice and I am not a qualified licensed investment advisor.
All information found here, including any ideas, opinions, views, predictions, forecasts, commentaries, suggestions, expressed or implied herein, are for informational, entertainment or educational purposes only and should not be construed as personal investment advice. While the information provided is believed to be accurate, it may include errors or inaccuracies.
I will not and cannot be held liable for any actions you take as a result of anything you read here.
Conduct your own due diligence, or consult a licensed financial advisor or broker before making any and all investment decisions. Any investments, trades, speculations, or decisions made on the basis of any information found on this channel, expressed or implied herein, are committed at your own risk, financial or otherwise.

Gold Futures GC - 1:3 opportunity setting up?Based on the market bias Gold may be setting up a 1:3 Risk:Reward? What are your thoughts? Will news impact the balanced flow of Gold?
GOLD FUTURESAccording to Gann: Gold and the "Square of the Range"---3 squares up in price = 4411. Gold is hugely overbought some are so ready to sell. If December Gold gets to 4411 and shows signs of topping, that do not mean it is the end of the rally.
It is overdue for a pullback it just may continue for a few years.

Gold Off to the Races | No Pullbacks, Just PressureNew week and Gold came out the gate running. Momentum’s been relentless — no pullbacks, no hesitation.
Price is still riding strong from last week’s 8HR FVG base, and now pressing into new highs around 4,150+.
With global tension fueling safe-haven demand, this could be a continuation week — but it’s getting stretched.
Watching 4,070–4,081 for possible re-entry if we get a midweek dip.
A close below 4,100 could signal exhaustion, while staying above keeps bulls firmly in control.
⚖️ Staying patient, no chasing — letting the market show if this leg still has fuel.
— Woodz | #NOFOMO #GoldFutures #MarketStructure

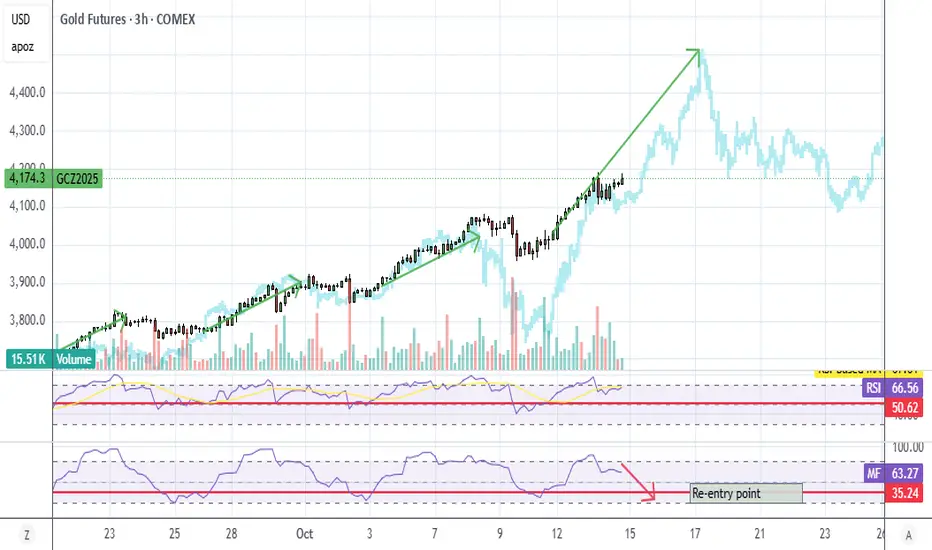
GC1 UpdateRevised overlay, expecting a dump sometime tonight or tomorrow morning. MFI pattern is similar to last push.
Target is still around 4500, but I could be wrong. Just watching for now.

Gold’s Relentless Ascent: Consolidation or the Next Breakout?Gold futures rose 2.3% for the week ending 10/Oct, marking the eighth consecutive weekly gain and lifting prices to a new all-time high above USD 4,000 per ounce. Despite the record-setting week, performance was mixed. Late in the week, gold came under pressure as risk sentiment improved following a ceasefire agreement between Israel and Hamas. Additional pressure came from a more hawkish tone in the Federal Reserve’s FOMC meeting minutes.
The main catalyst on 10/Oct (Fri) was President Trump’s threat to impose 100% tariffs on Chinese goods over rare earth restrictions. The move sharply escalated trade tensions, driving a surge in uncertainty—as reflected by higher implied volatility (IV)—and briefly weighing on gold near the USD 4,000 level. By 13/Oct (Mon), Trump’s subsequent comments signalled that the escalation might be short-lived, improving sentiment and propelling gold to a new all-time high.
This paper analyses signals from gold options and technical indicators to evaluate gold’s historical behaviour around all-time-high levels and assess the probability of a correction following record-setting peaks.
Gold Options Show Bullish Bias but Cautious Trading
Source: CME QuikStrike
CME Gold options activity for the October and December expiries reflects a modestly bullish market sentiment, with call interest exceeding put interest.
Most positions are concentrated in December 2025, showing a focus on year-end contracts. Overall, sentiment is positive but cautious, with traders managing short-term risks.
Source: CME QuikStrike
New open interest over the past week has turned sharply cautious, with a notable buildup in put options. While long-term optimism remains, the recent increased put positioning signals emerging downside risks.
Source: CME CVOL
CME Gold volatility has climbed alongside its price surge, although notably the IV spike on 10/Oct (Fri) when Trump announced higher tariffs on China was much smaller than the one observed in April. The skew spike and convexity spike were also smaller than before suggesting less bullish positioning.
Technical signals for Gold futures remain firmly bullish, with short-term moving averages and the MACD reinforcing upward momentum.
RSI indicates overbought conditions, although this typically signals a potential reversal, prices may continue to rise, supported by strong fundamental and macroeconomic factors.
Gold futures traded above the monthly pivot throughout October, breaking past the R1 level on 13/Oct (Mon), signalling a strong ongoing uptrend.
The Accumulation/Distribution indicator shows rising buying pressure since mid-August, peaking on 08/Oct (Wed) before briefly easing and recovering thereafter.
Historical Trends Around All-Time-High Price Level
The rally in gold prices over the past two years has been exceptionally sharp, with few historical parallels. However, similar periods of sustained bullish momentum can be identified. When filtering for occasions in which the RSI exceeded 80 (indicating extreme overbought conditions) and the MACD line rose above 70 (signaling strong, sustained bullish momentum), two notable instances emerge: 2011 and 2020. In both cases, gold reached new all-time highs.
These same technical thresholds were recently triggered again as gold set a new all-time high on 13/Oct (Mon). Historically, such signals followed multi-year rallies characterized by a steady bullish regression trend. At the final stage of each rally, prices broke above the regression trend in a blow-off top pattern.
The recent activation of both extreme bullish signals, along with the breakout above the trend, suggests a similar blow-off top may be forming. In the previous instances, this pattern was followed by immediate corrections: gold prices fell 9% in 2011 and 5.6% in 2020 within a month of setting new highs. It should be noted that past performance is not indicative of future trends.
This content is sponsored.
MARKET DATA
CME Real-time Market Data helps identify trading set-ups and express market views better. If you have futures in your trading portfolio, you can check out on CME Group data plans available that suit your trading needs tradingview.com/cme .
DISCLAIMER
This case study is for educational purposes only and does not constitute investment recommendations or advice. Nor are they used to promote any specific products, or services.
Trading or investment ideas cited here are for illustration only, as an integral part of a case study to demonstrate the fundamental concepts in risk management or trading under the market scenarios being discussed. Please read the FULL DISCLAIMER the link to which is provided in our profile description.

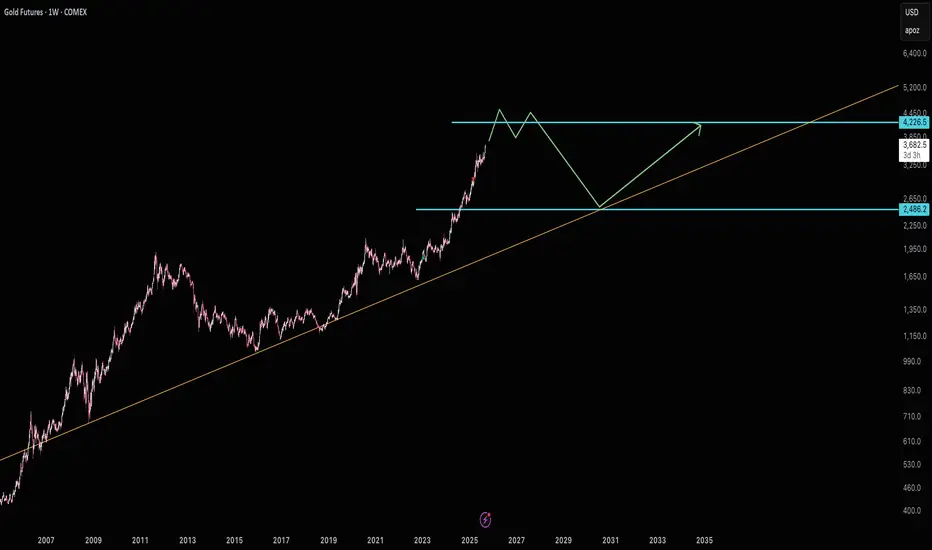
Gold is in a bubbleGold appears to be running straight up to resistance without ever forming support around $2486. This is not a good sign for gold buyers. I'm highly speculating gold will fall back to $2486. This move is similar to 1979. As in 1979 it went significantly higher than resistance before falling all the way back down to support. So be cautious, this could go much higher than $4220 before coming back to reality.
Good luck!
Momentum Breakout into Strength | D-H Flip ConfirmedStrong continuation from last session’s impulsive push.
I caught my move during the Tokyo impulsive hour after price broke cleanly above 4175 — confirming a momentum breakout setup on the 15-min chart.
The previous Daily High (4191.2) has now flipped into solid support, reinforcing the bullish narrative I’ve been tracking since the start of the week.
My original weekly target was 4200 — we’ve exceeded that level now, and the momentum still looks healthy.
Price action is slowing ahead of the London session, which could set the stage for another expansion leg. If bullish pressure holds, I’m watching 4230–4250 next, with 4500 as a stretch target.
💡 Key Notes:
Setup: Momentum Breakout
Bias: Bullish
Entry: 4177.3 | Exit: 4185.1
Result: +$386 (5 Contracts)
Time in Trade: 42m
Context: Daily High Flip + Strong Impulse Continuation
#Gold #Futures #DayTrading #PriceAction #Breakout #TradingView #MGC #Trader #NoFOMO #Discipline #MomentumBreakout #ICTInspired

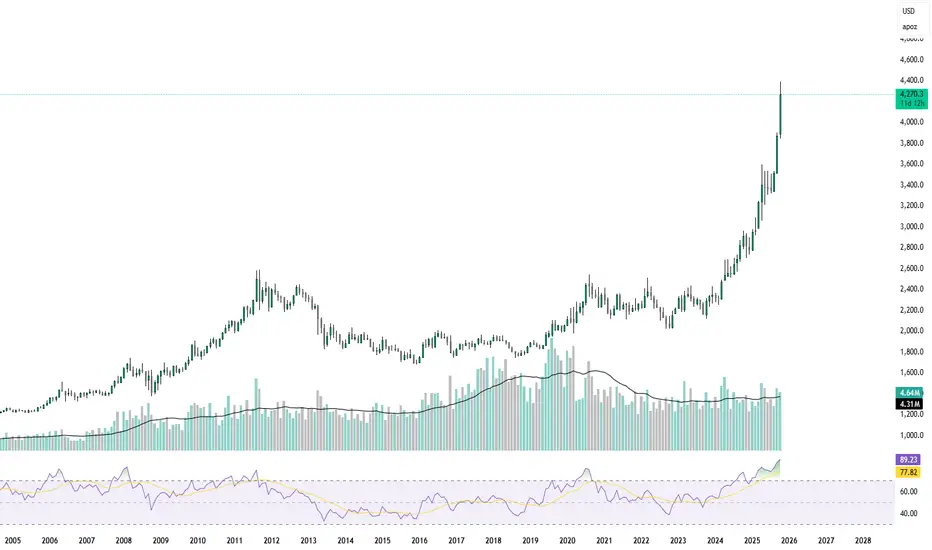
Gold Outlook – A Historical Signal of an Impending DeclineSince 1970, gold (GC – CME) has experienced six major crashes, each occurring right after eight consecutive green weekly closes.
In every case, the market first showed what seemed like a “healthy buying phase” — strong optimism and aggressive inflows — before a sharp reversal took place.
Historical data reveals a clear pattern:
In the first week after the streak, gold fell an average of 11.8%.
By week four, the average drawdown deepened to 23.5%.
And within eight weeks, the total average decline reached up to 33%.
This pattern suggests that gold tends to build extreme bullish momentum before major corrections, as traders chase prices higher and sentiment detaches from fundamentals.
Currently, after another extended streak of weekly gains, gold once again sits in the same statistical zone that historically preceded a significant pullback.
If history repeats itself, we may soon witness a sharp correction — a natural reset after an overheated rally.

Gold buy above 117815 tgt 120000 positonalGold buy above 117815 tgt 120000 positonal
Gold buy above 117815 tgt 120000 positonal
Gold buy above 117815 tgt 120000 positonalGold buy above 117815 tgt 120000 positonalGold buy above 117815 tgt 120000 positonalGold buy above 117815 tgt 120000 positonalGold buy above 117815 tgt 120000 positonalGold buy above 117815 tgt 120000 positonalGold buy above 117815 tgt 120000 positonalGold buy above 117815 tgt 120000 positonalGold buy above 117815 tgt 120000 positonalGold buy above 117815 tgt 120000 positonalGold buy above 117815 tgt 120000 positonalGold buy above 117815 tgt 120000 positonalGold buy above 117815 tgt 120000 positonal
